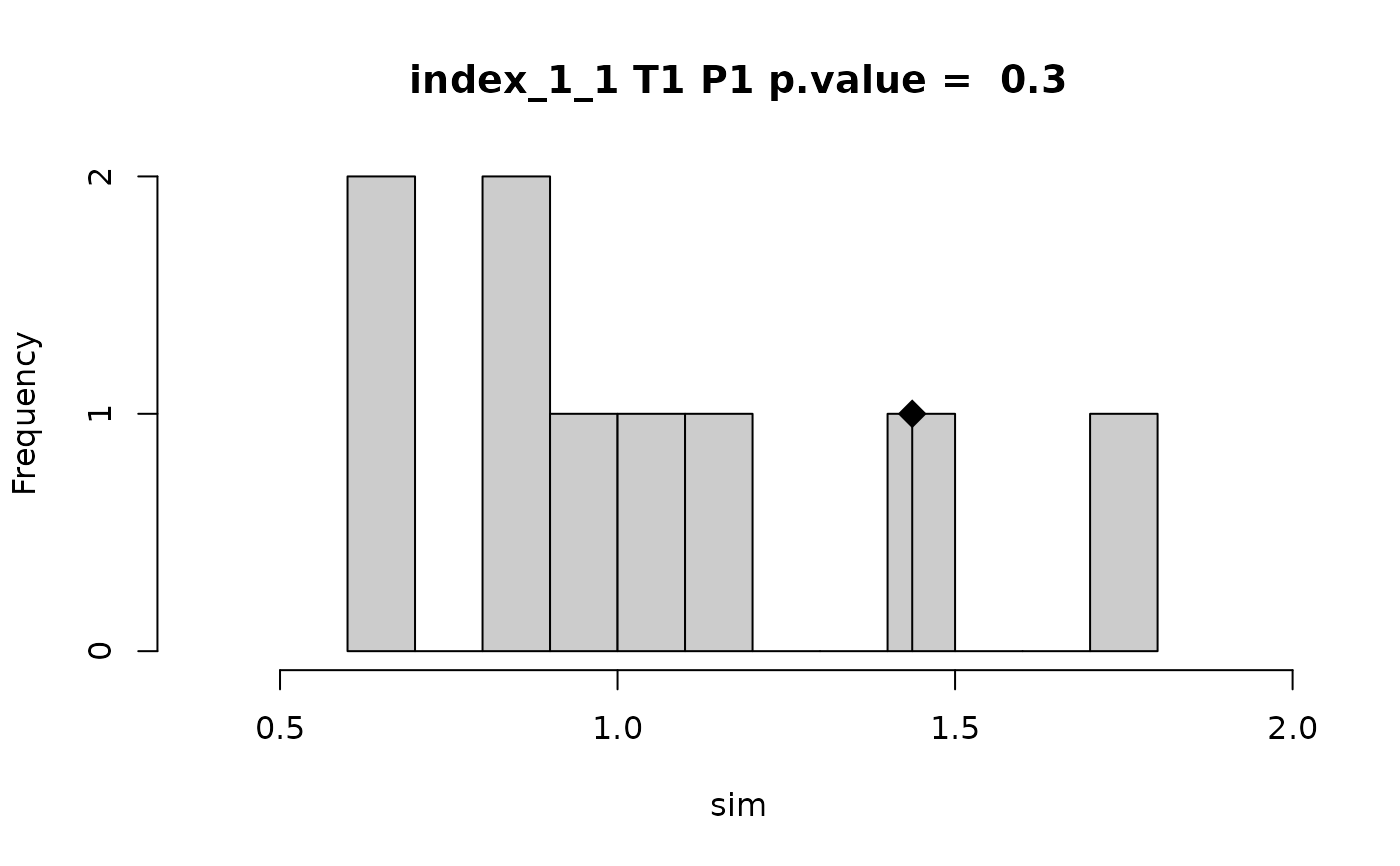
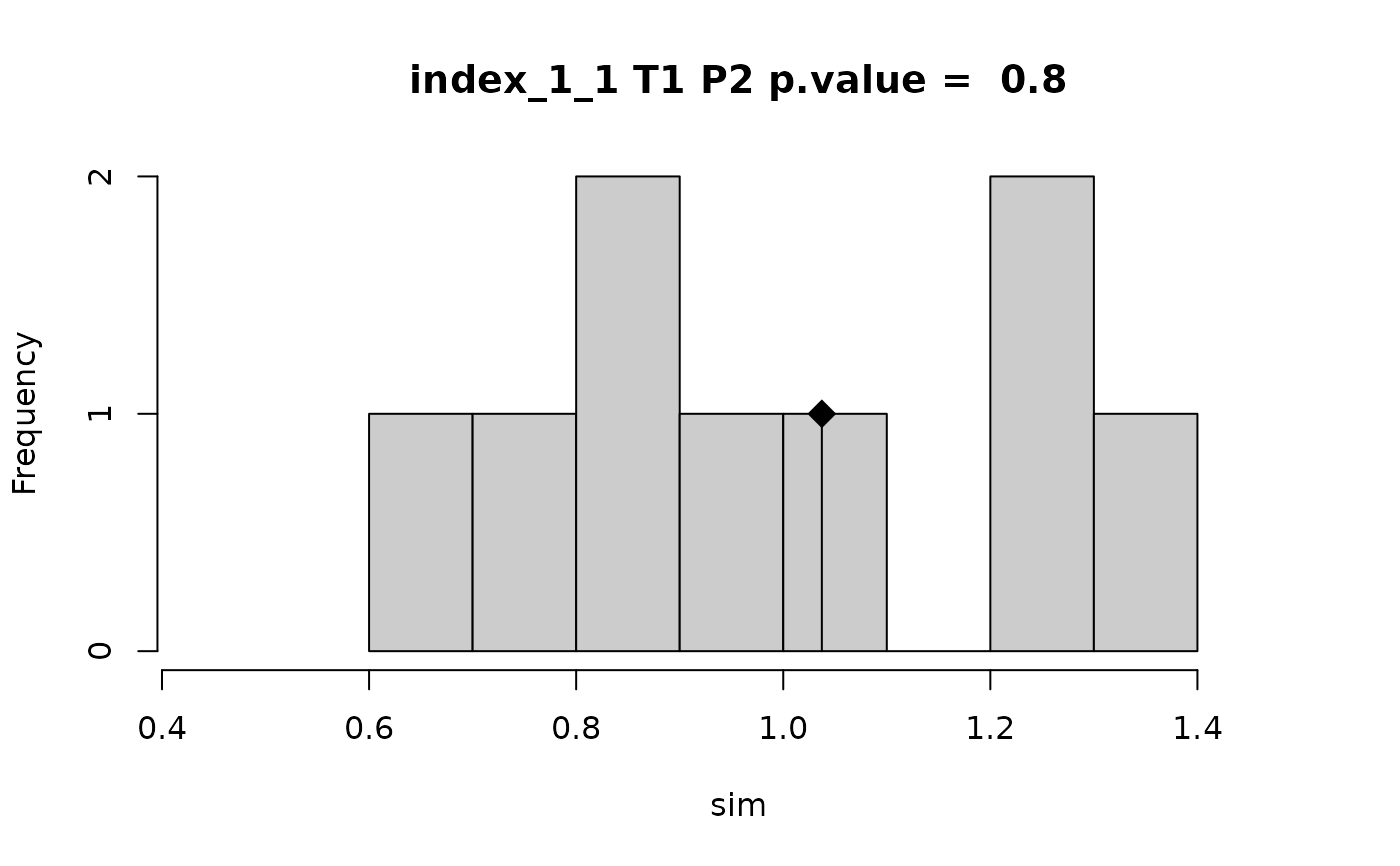
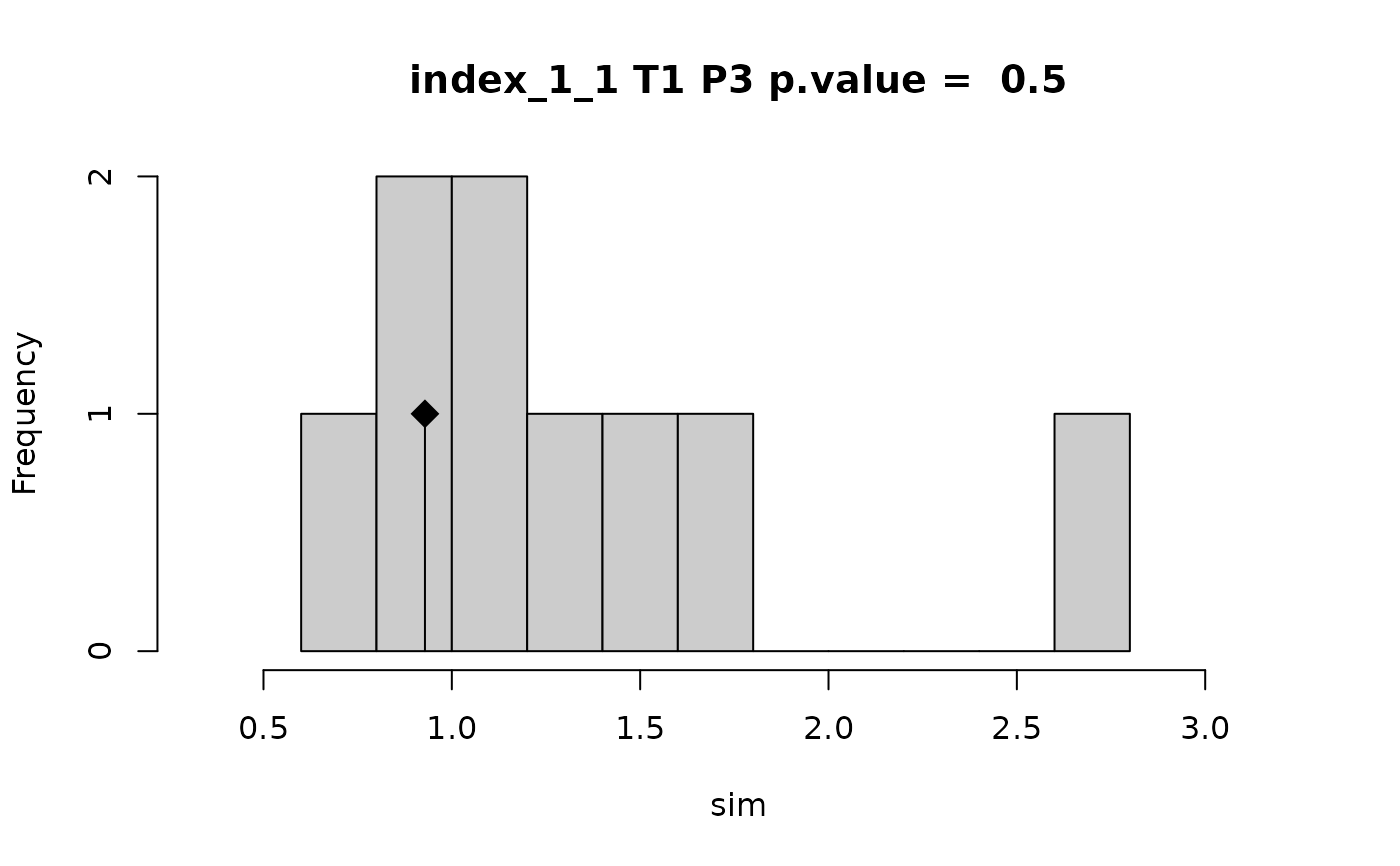
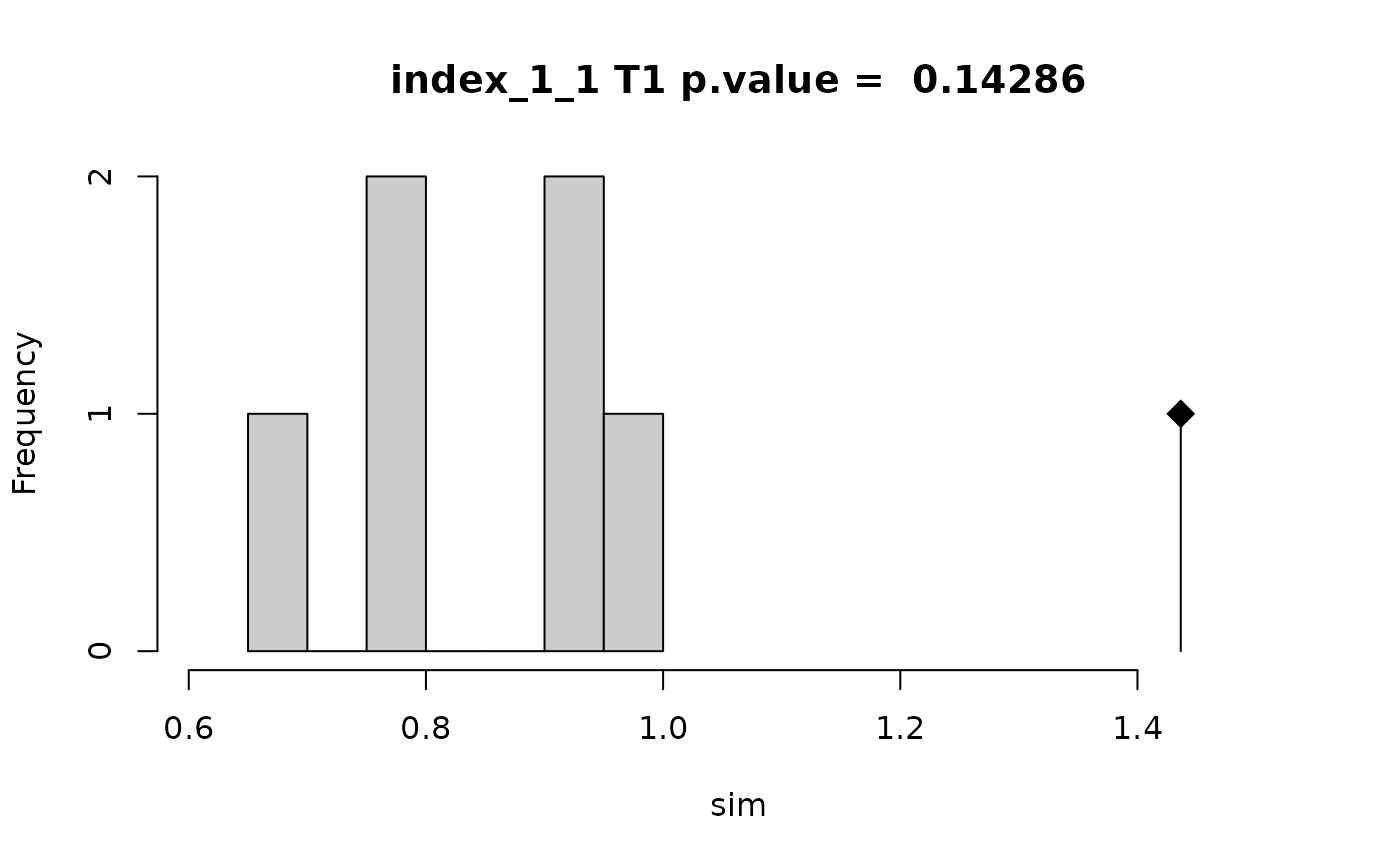
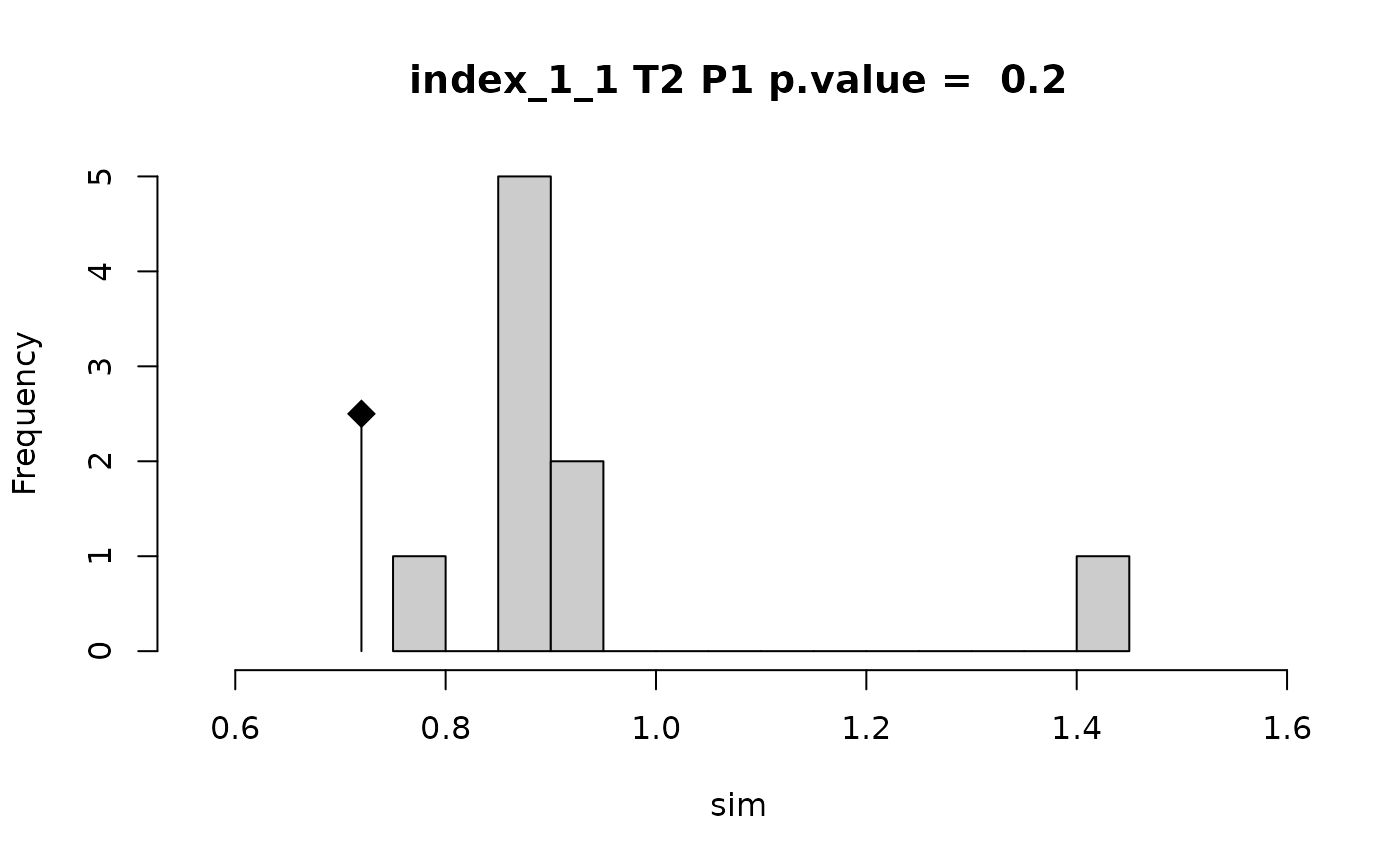
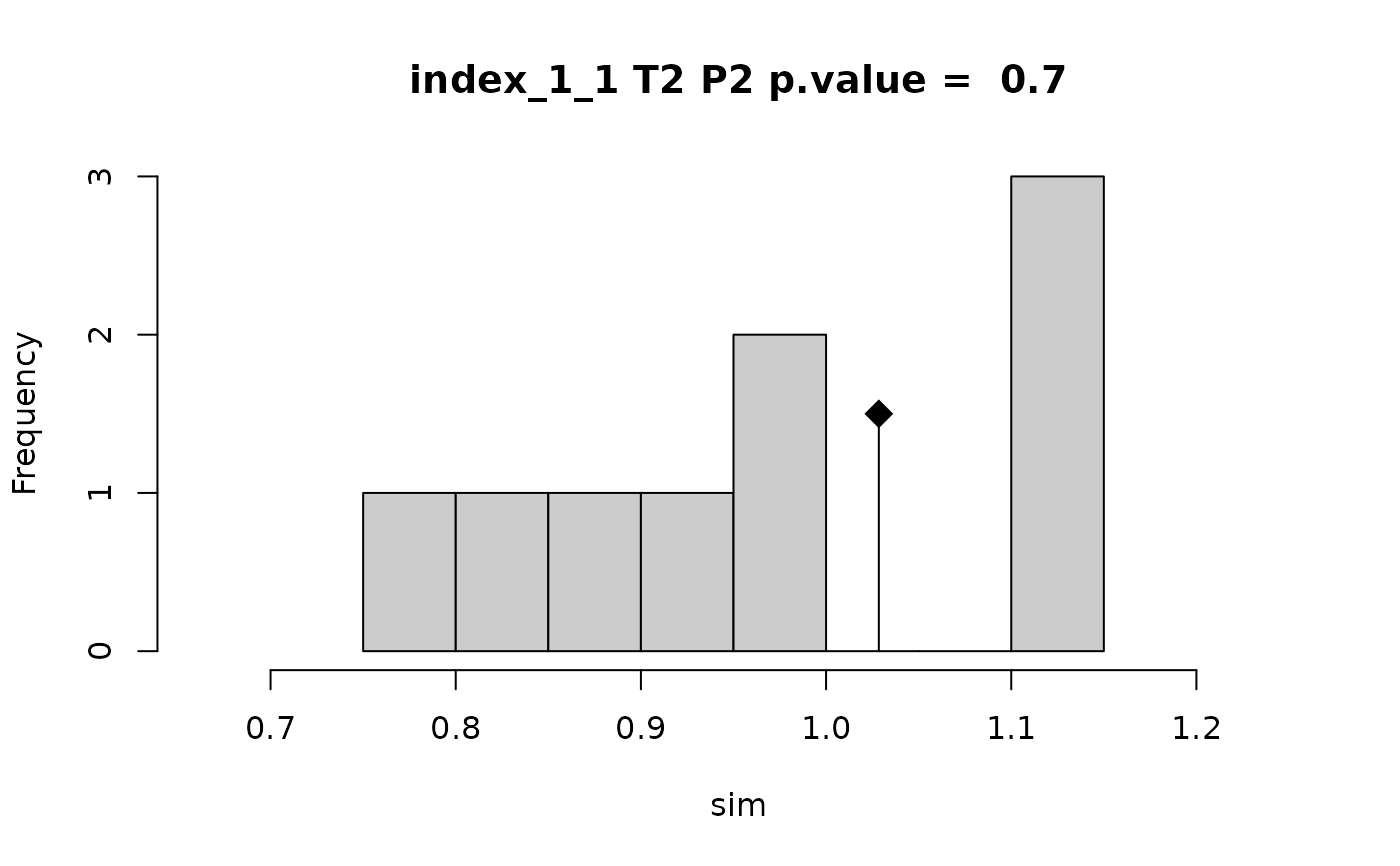
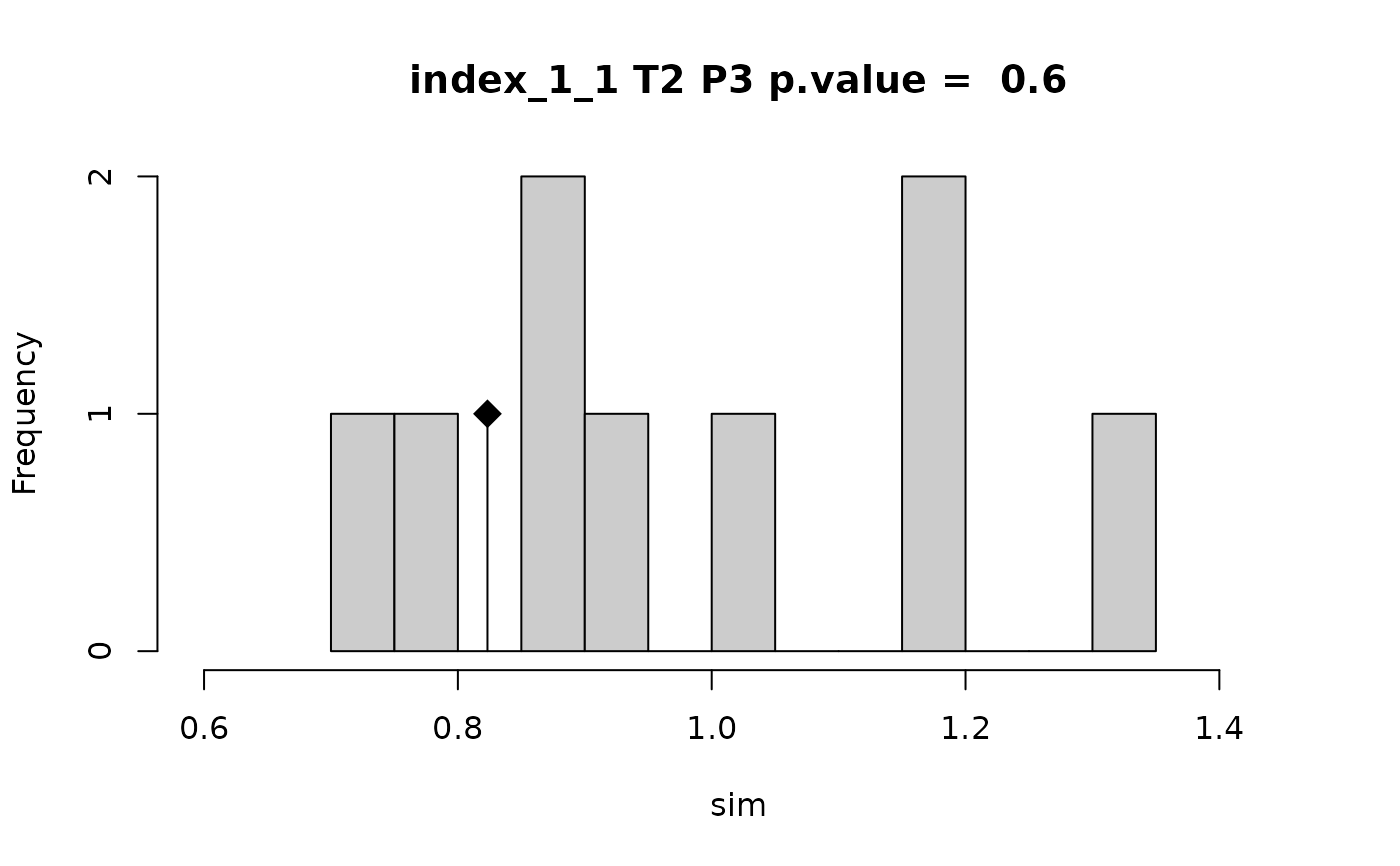
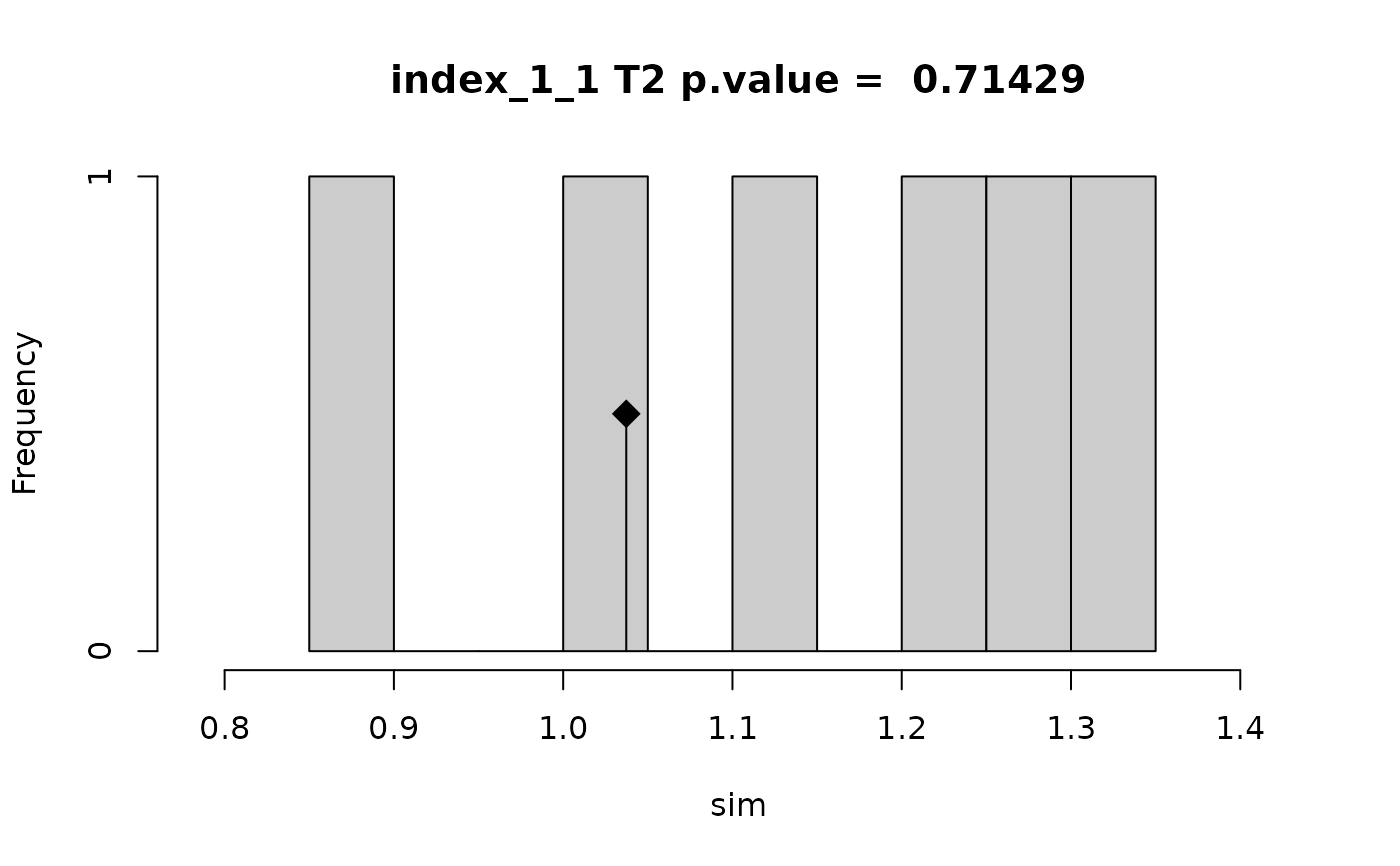
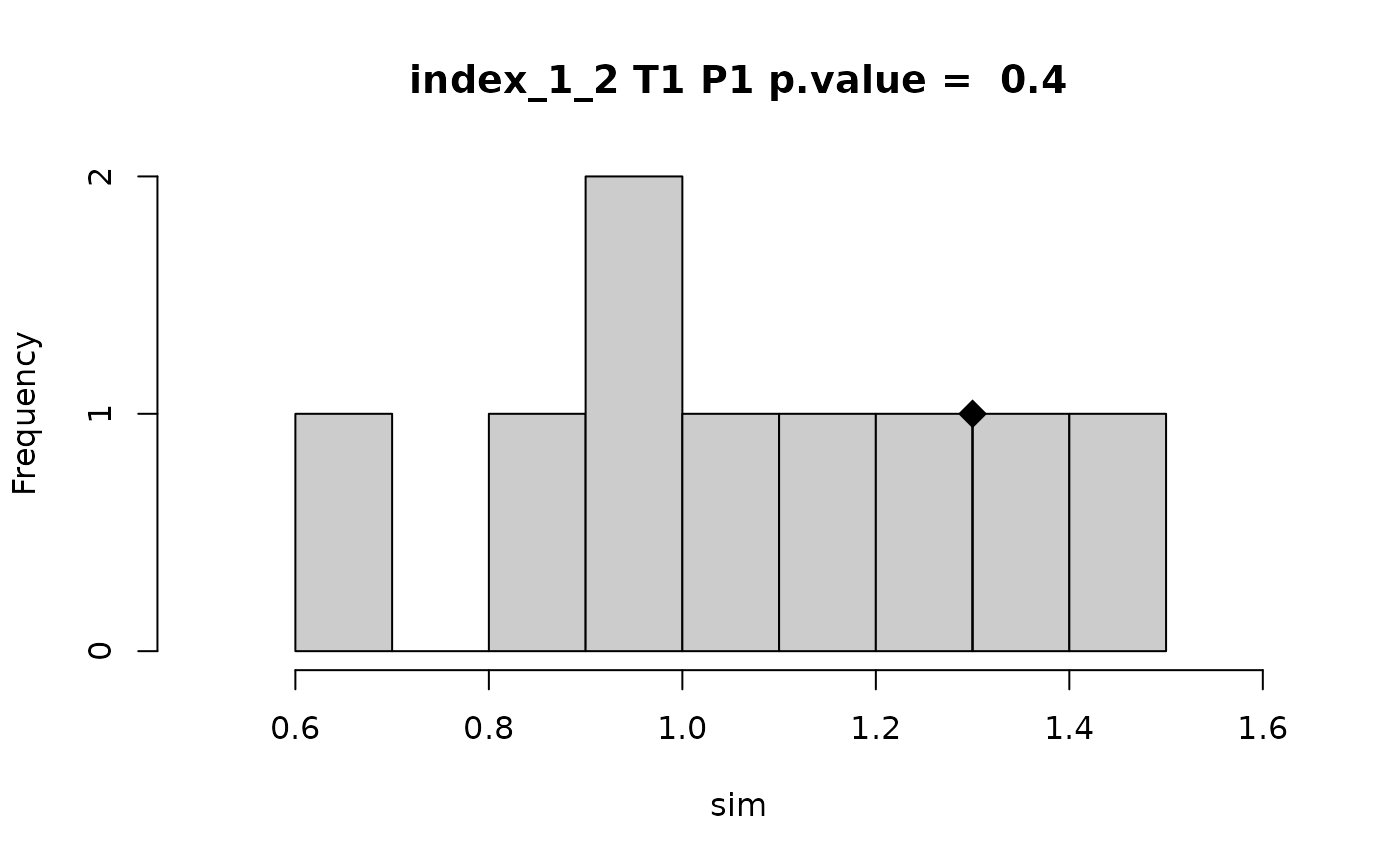
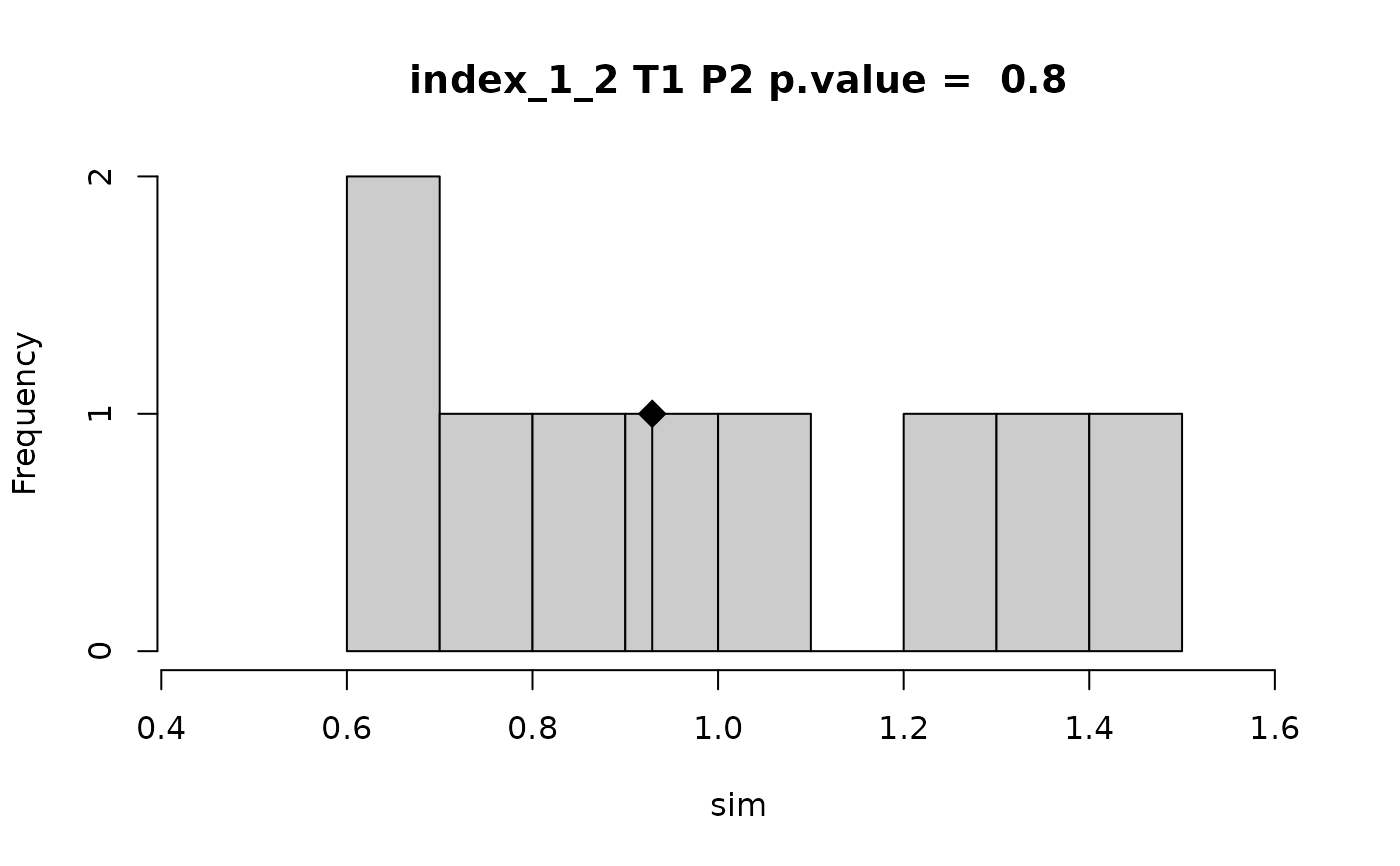
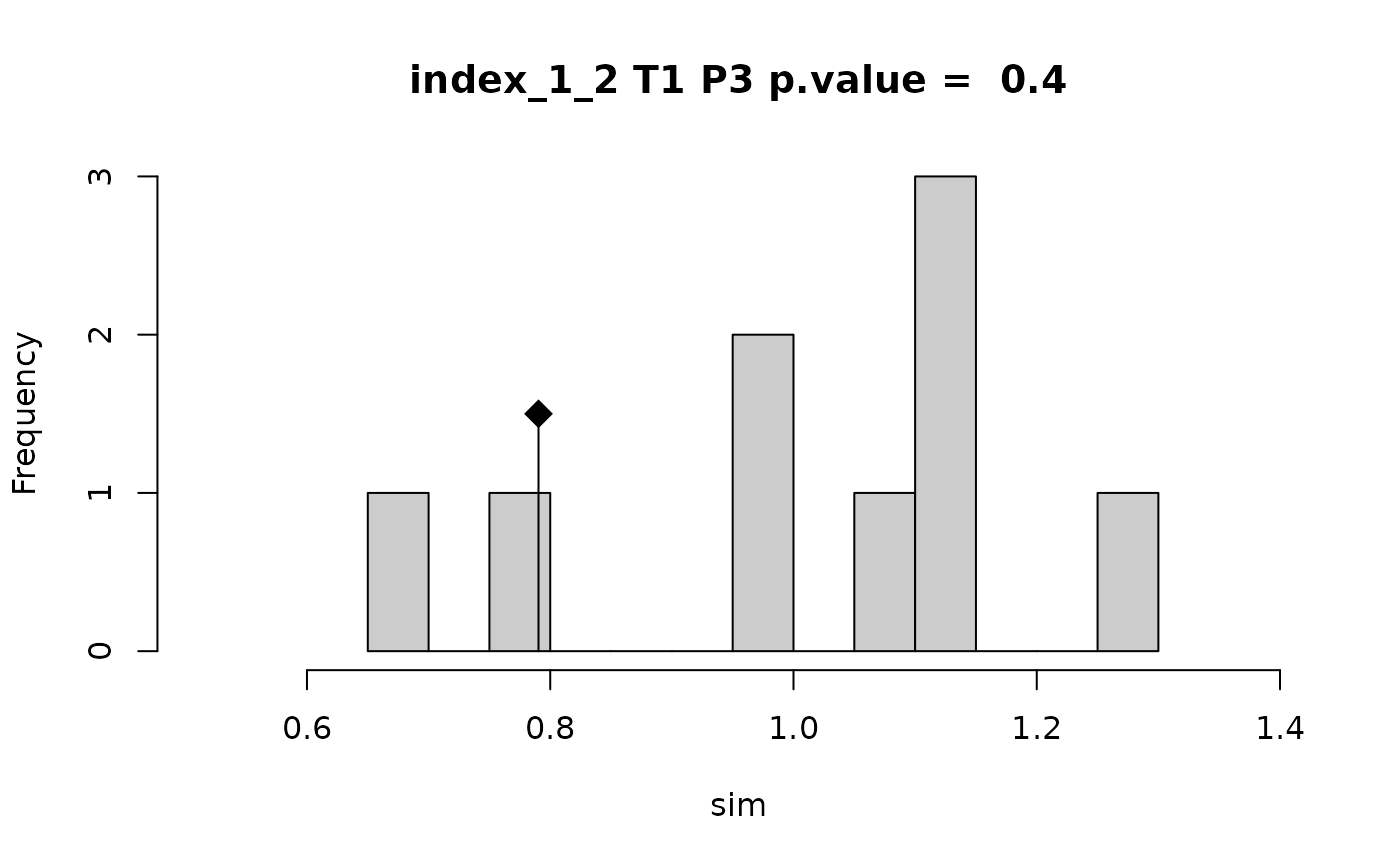
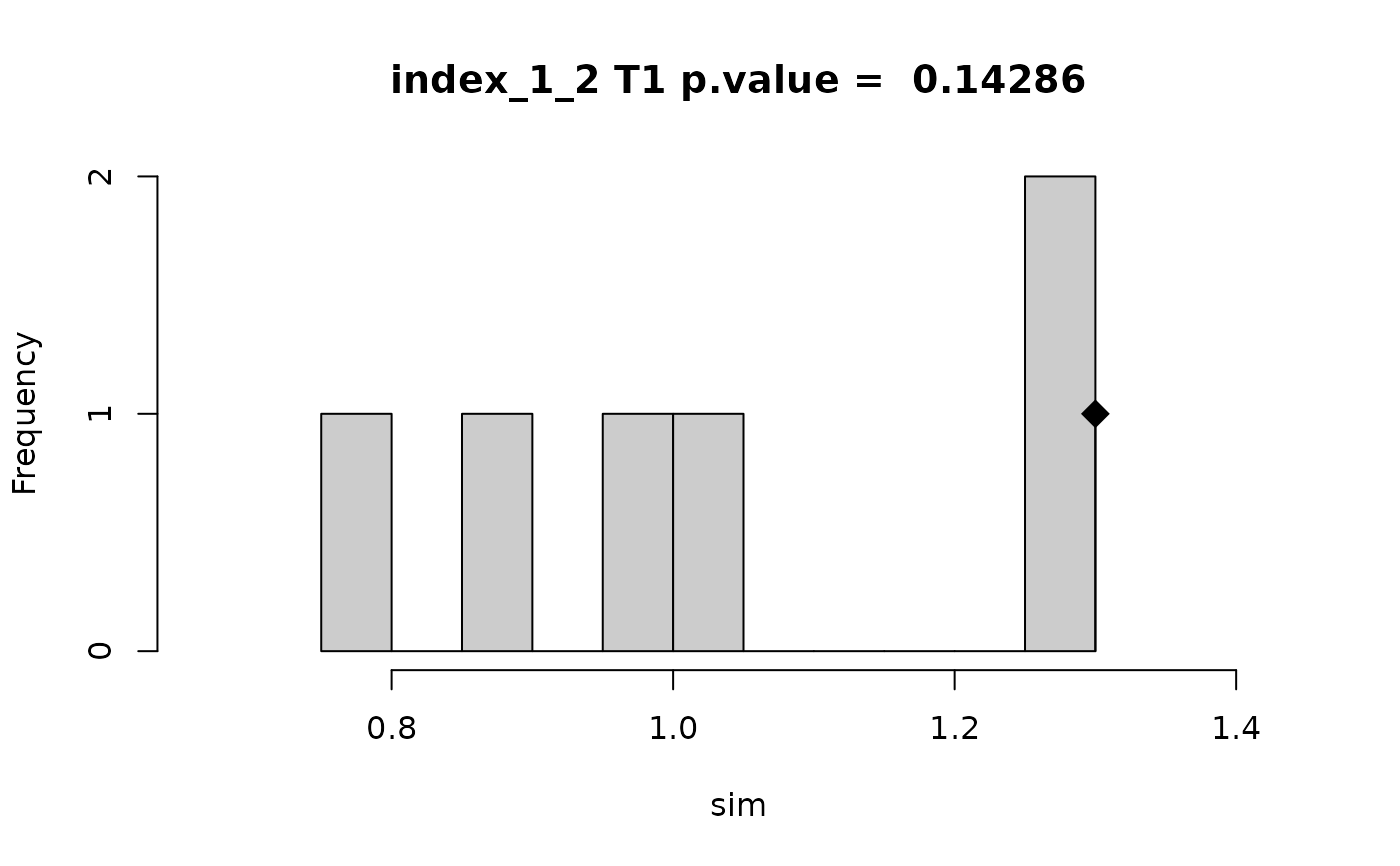
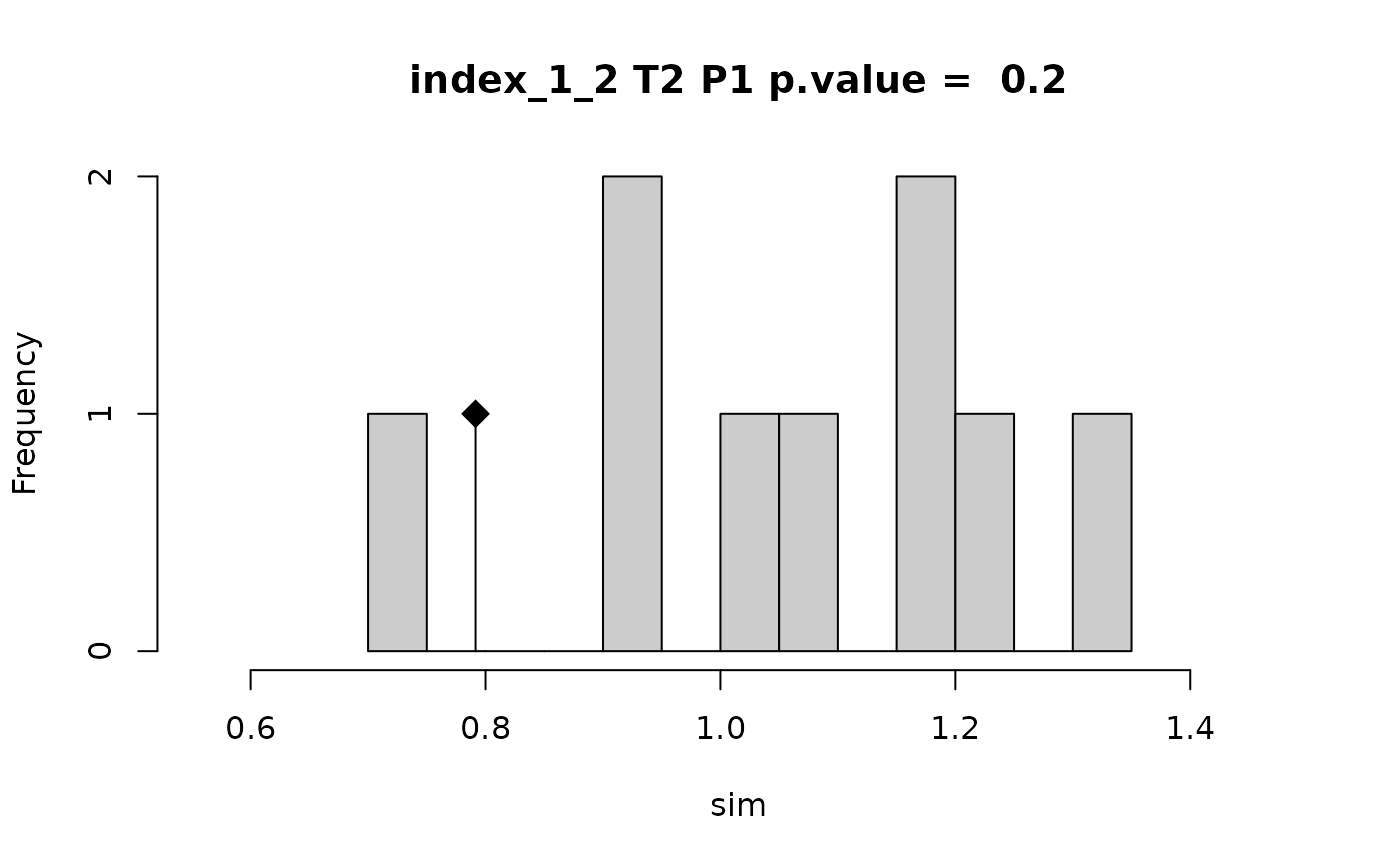
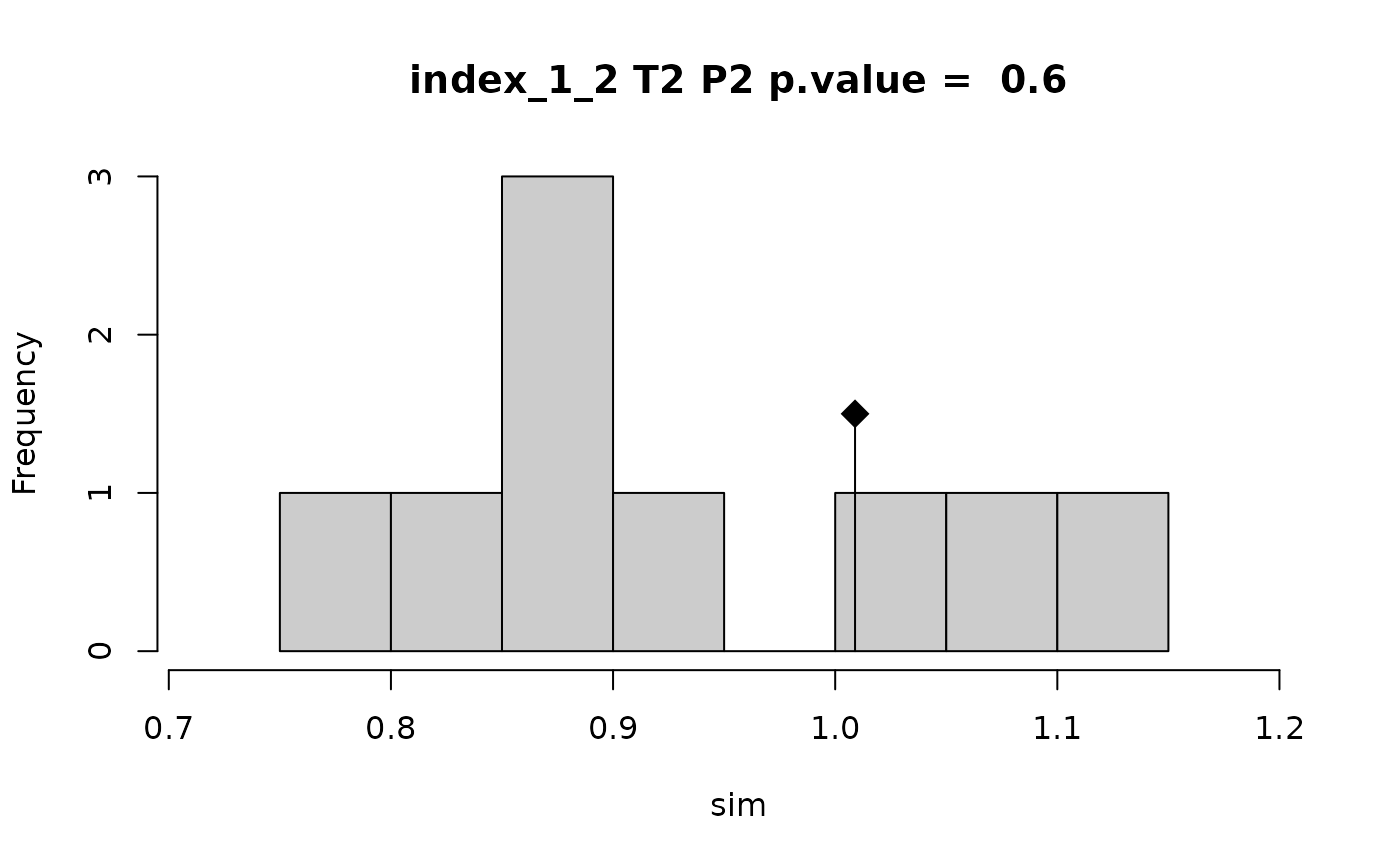
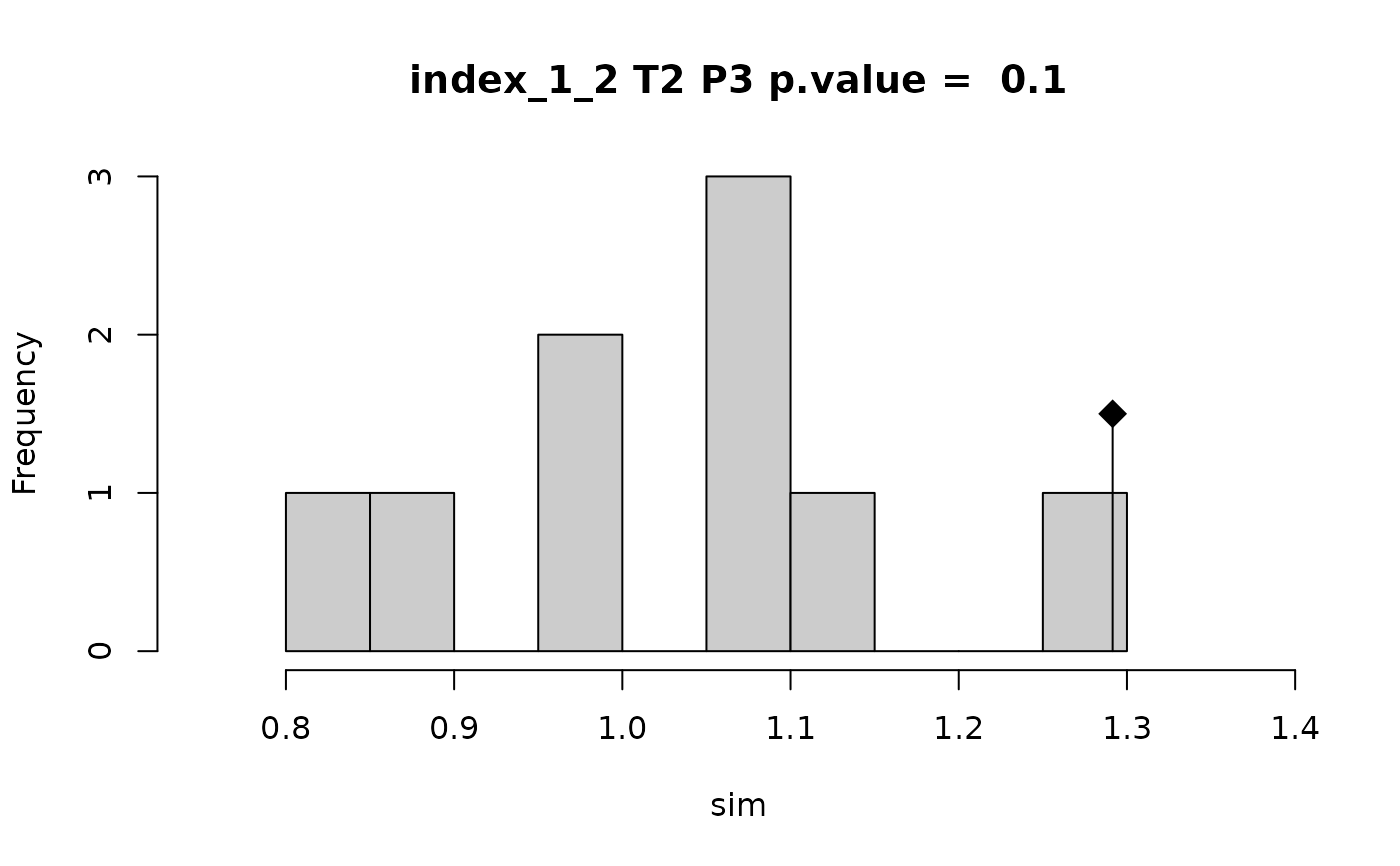
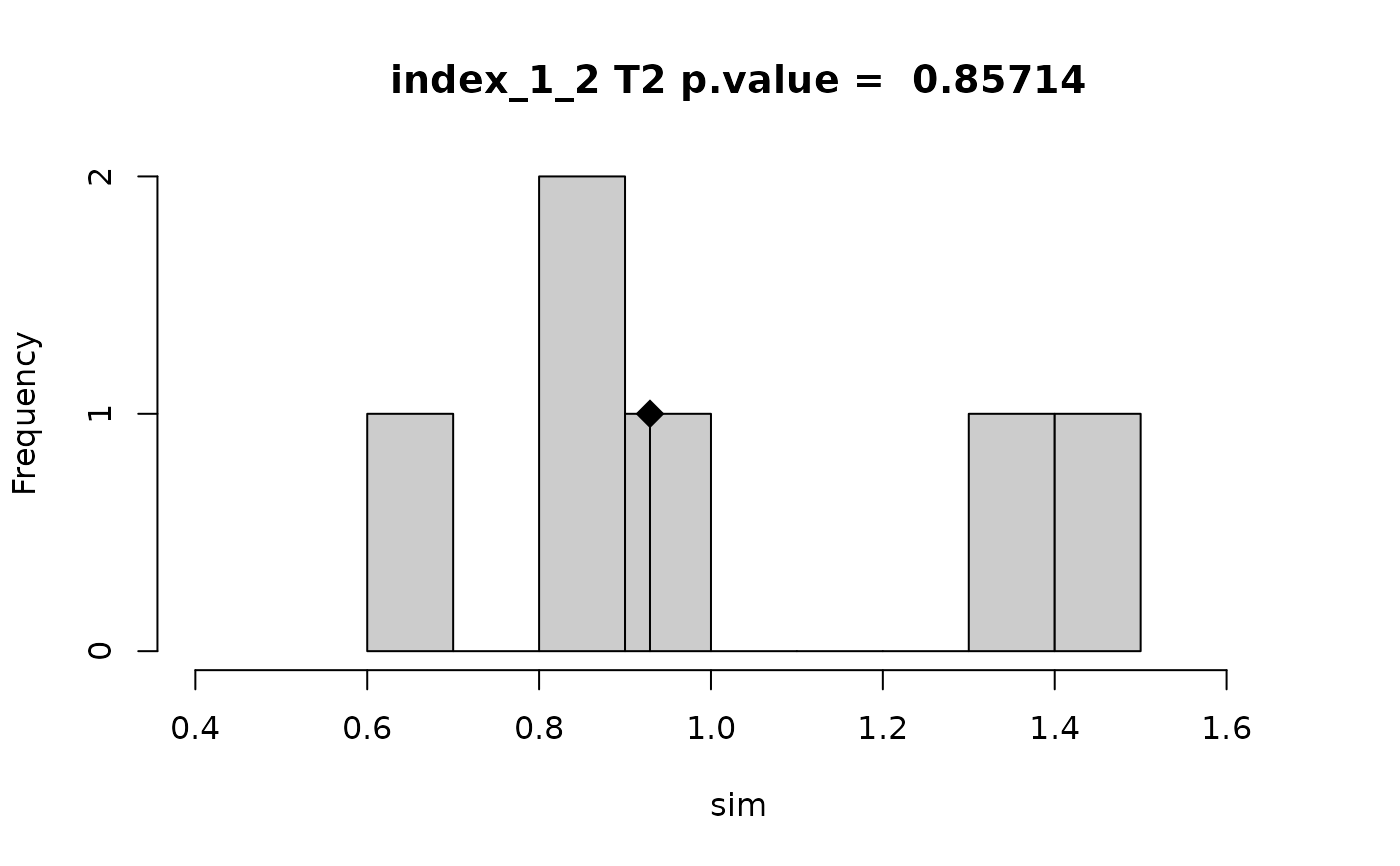
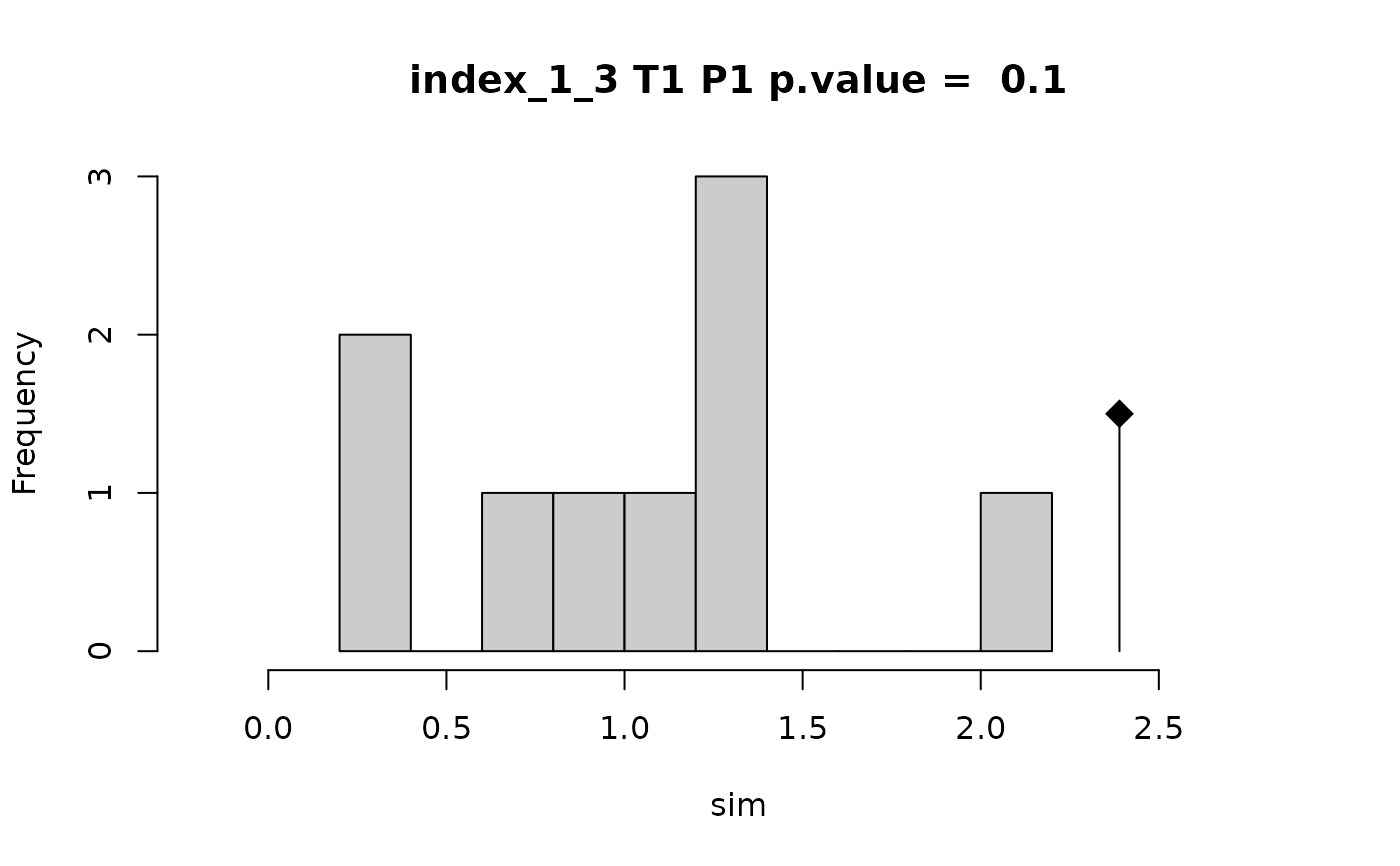
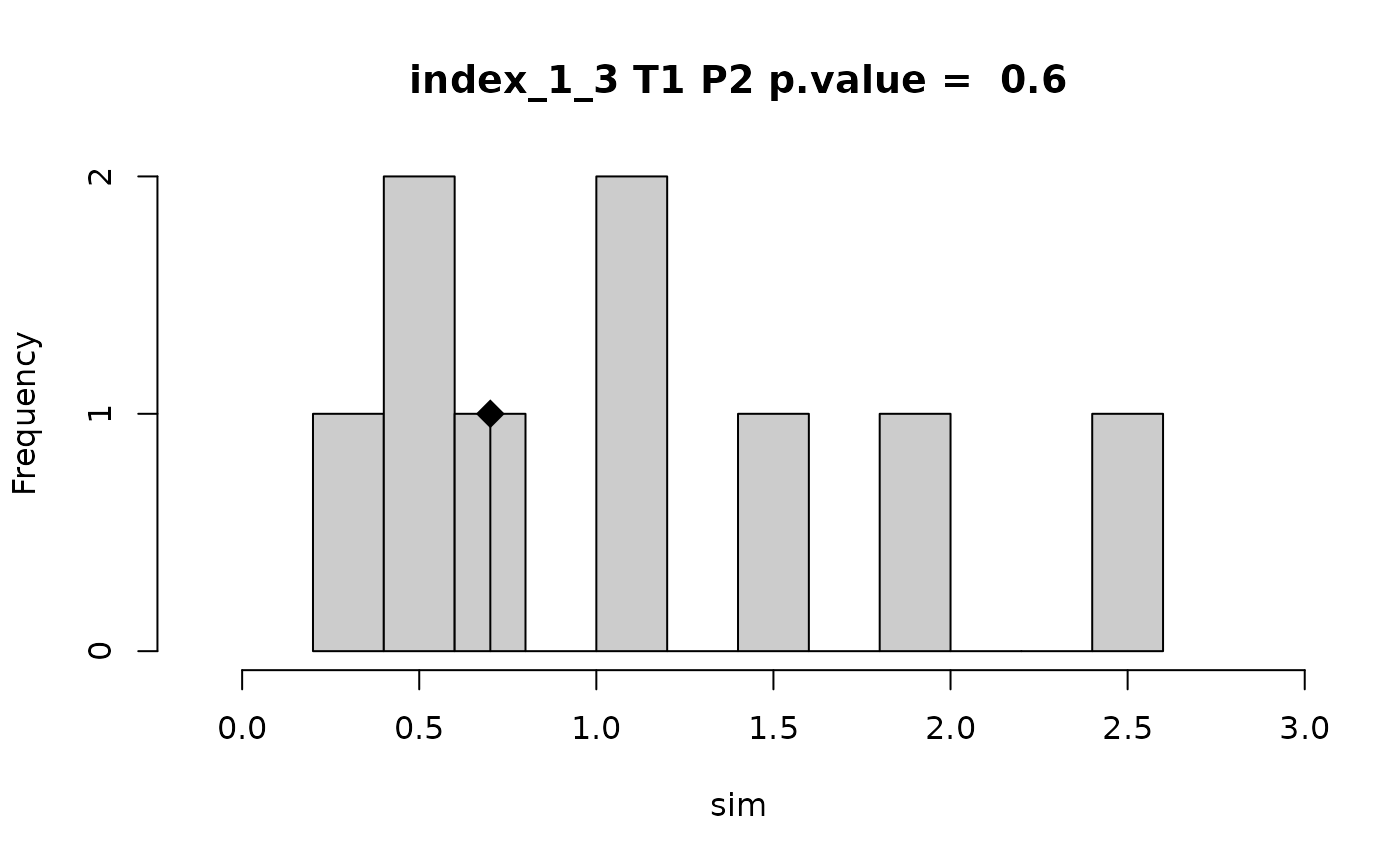
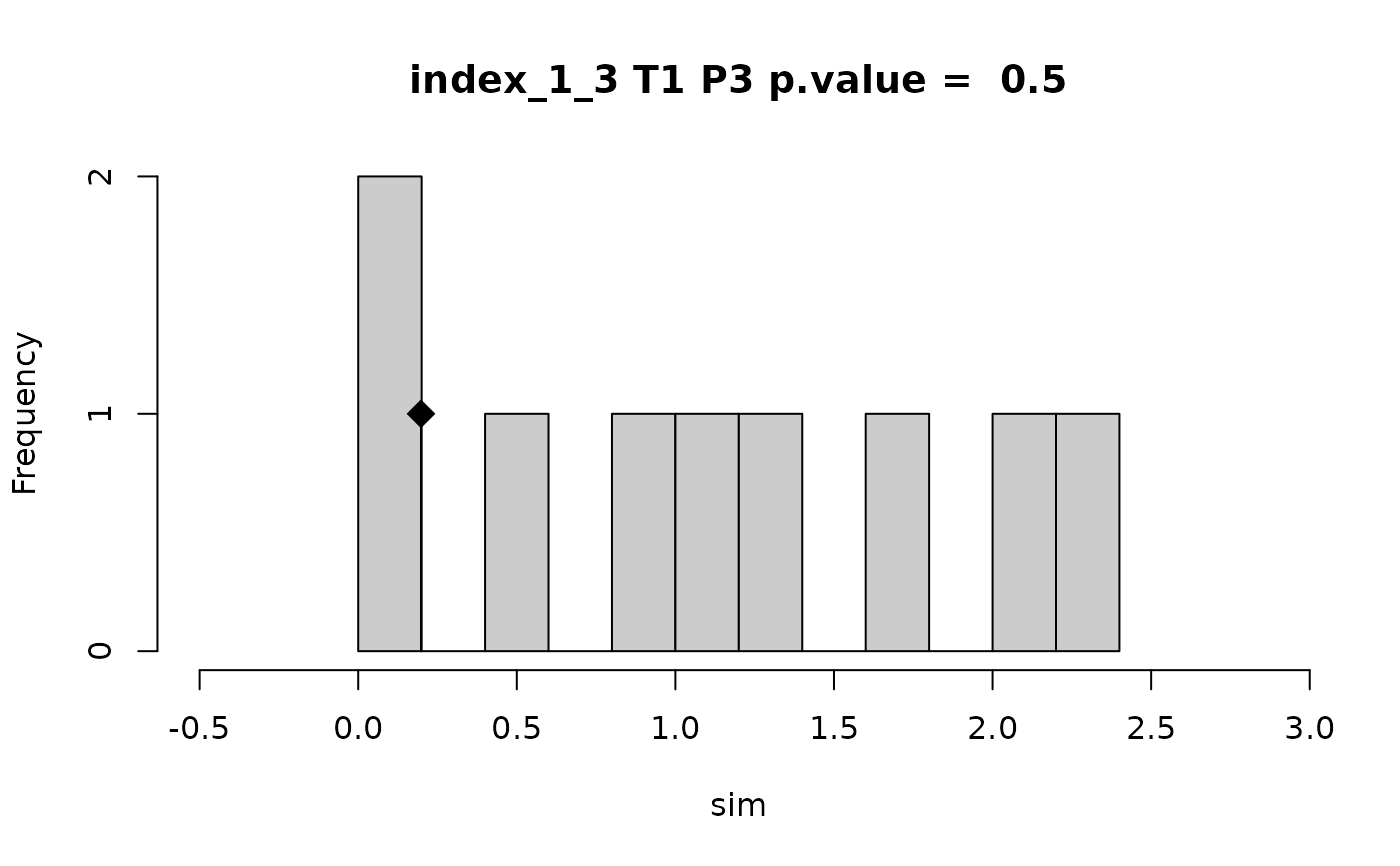
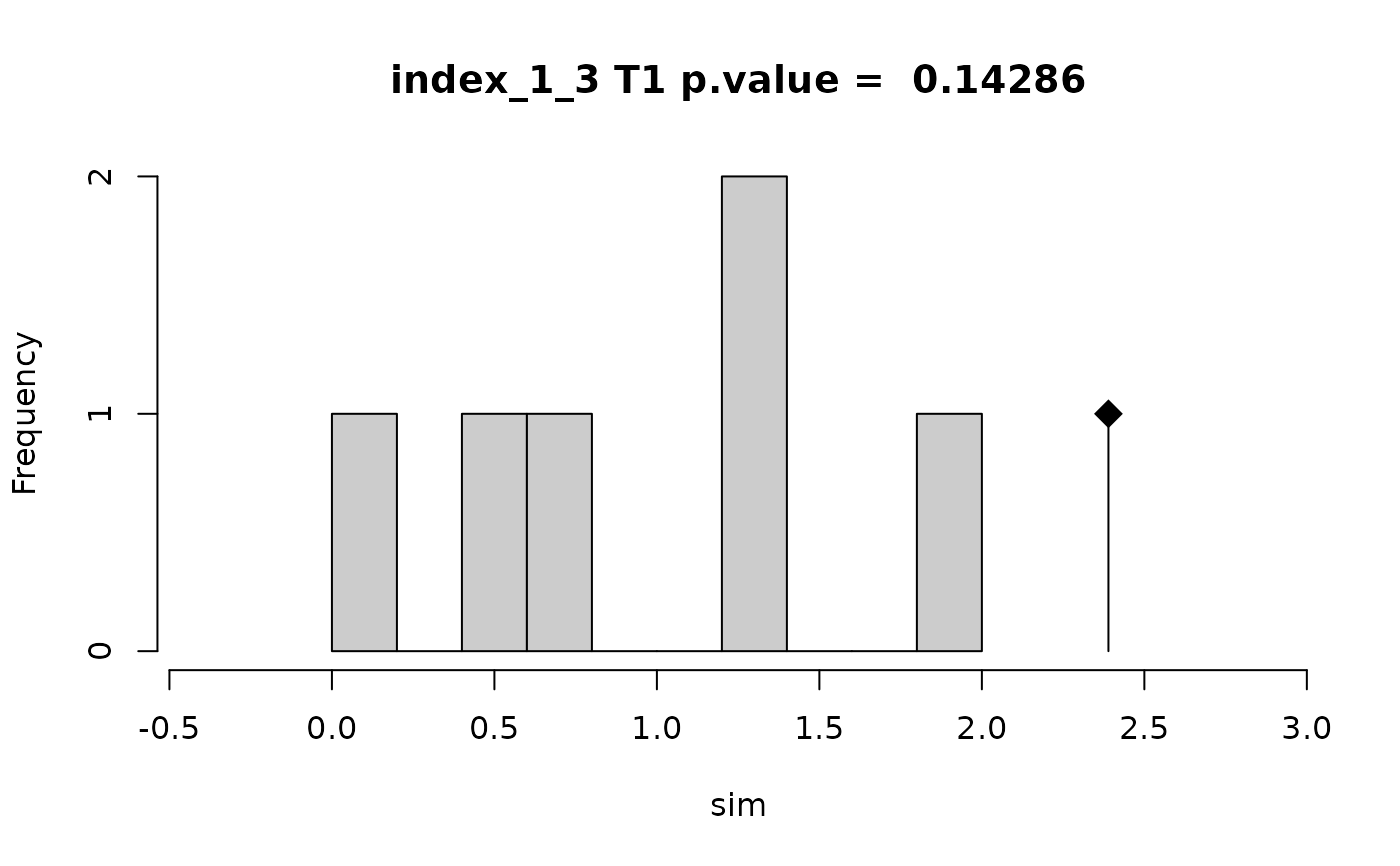
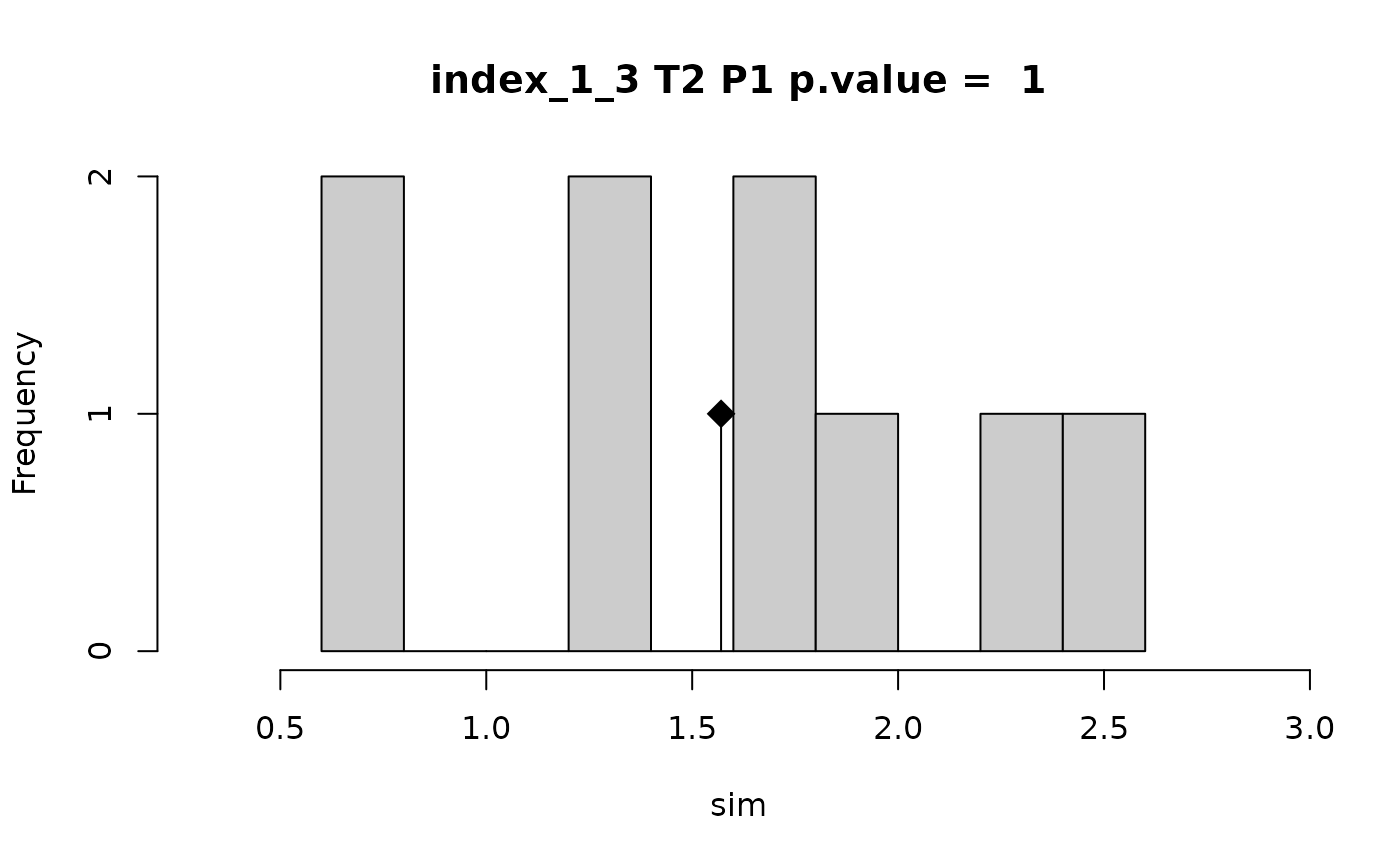
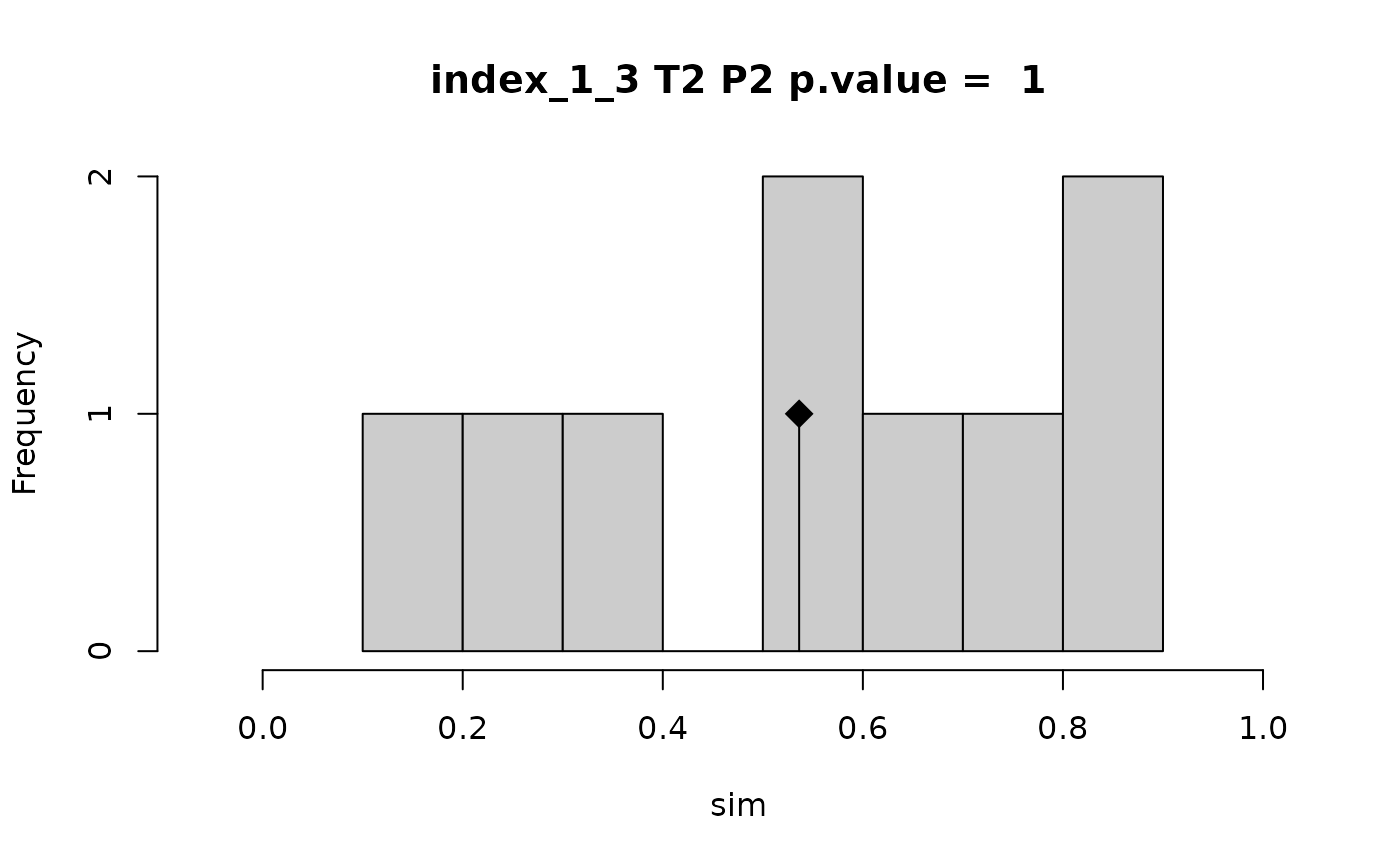
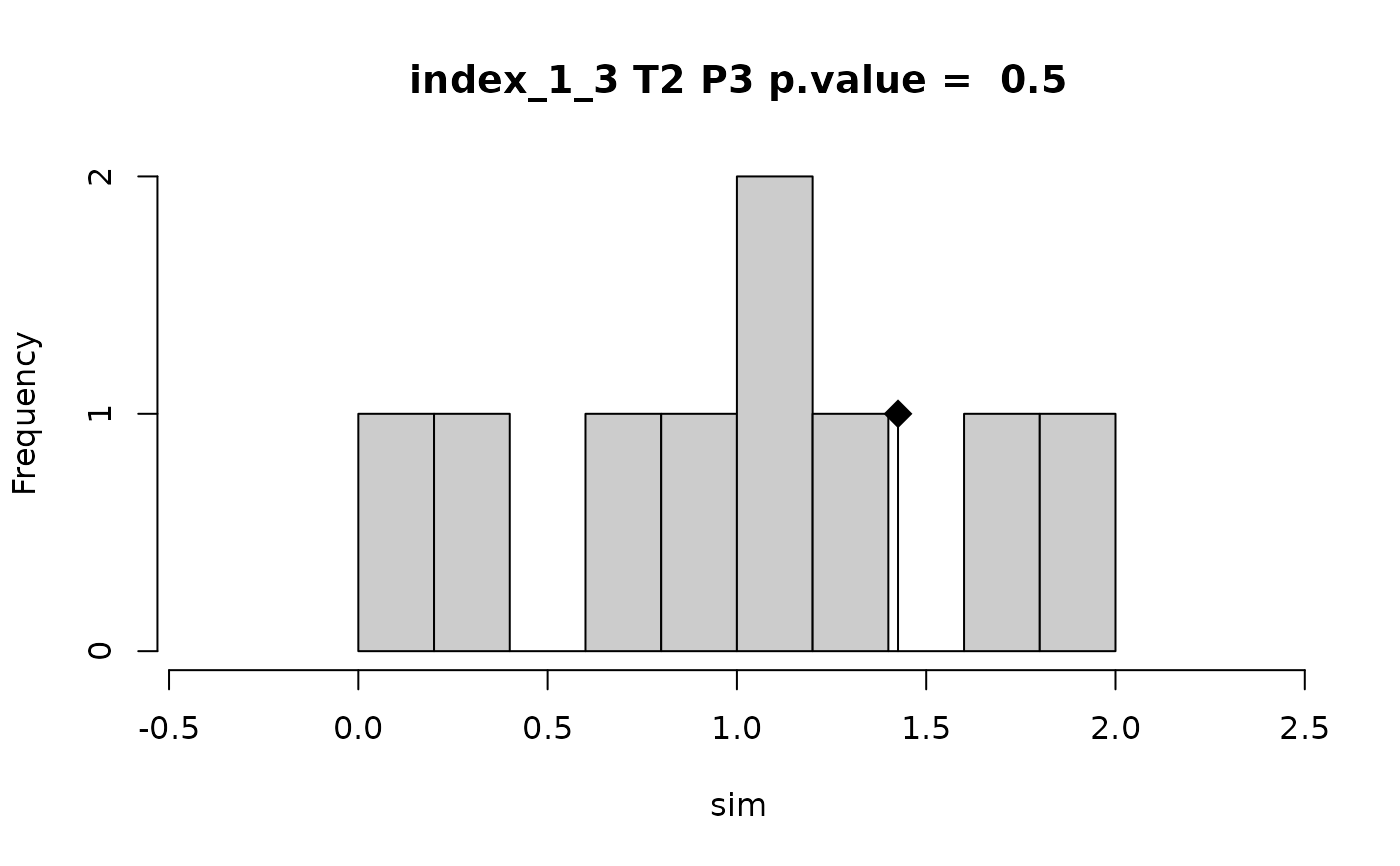
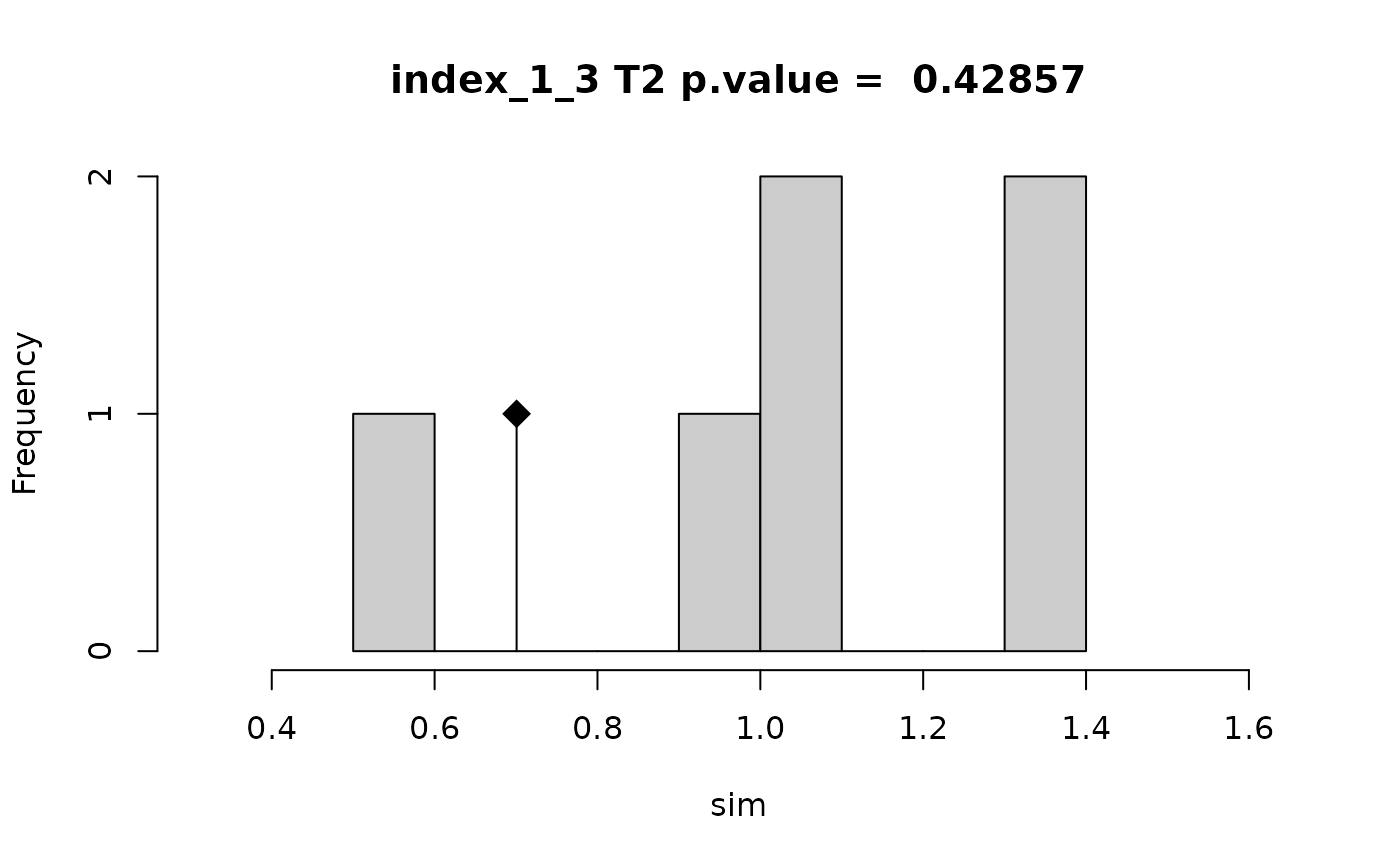
Plot result of observed indices values against null distribution
plotRandtest.RdFunction to plot result of observed indices values against null distribution.
Arguments
- x
An object of class listofindex, ComIndex, ComIndexMulti or Tstats.
- alternative
Indicates the alternative hypothesis and must be one of "two.sided", "greater" or "less". You can specify just the initial letter. "greater" corresponds to positive association, "less" to negative association.
- ...
Any additional arguments are passed to the plot function creating the core of the plot and can be used to adjust the look of resulting graph.
Examples
# \donttest{
  # Simulate a small NA-free dataset to avoid empty null distributions
  set.seed(42)
  n <- 60
  traits_sim <- matrix(rnorm(n * 2), nrow = n, ncol = 2,
                       dimnames = list(NULL, c("T1", "T2")))
  sp_sim <- factor(rep(paste0("sp", 1:10), each = 6))
  plot_sim <- factor(rep(paste0("P", 1:3), each = 20))
  res_sim <- Tstats(traits_sim, ind.plot = plot_sim,
                   sp = sp_sim, nperm = 9, printprogress = FALSE)
  plotRandtest(res_sim)


# }
# }