Calculates the total carbon footprint of a targets pipeline by analyzing
the metadata from completed targets. This function is a wrapper around
ga_footprint() that automatically extracts runtime and storage information
from the targets metadata and computes the cumulative environmental impact.
The function aggregates:
Total runtime across all targets
Memory usage patterns (when storage estimation is enabled)
Hardware specifications you provide
Usage
ga_targets(
  names_targets = NULL,
  targets_only = TRUE,
  complete_only = FALSE,
  store = targets::tar_config_get("store"),
  tar_meta_raw = NULL,
  ...
)
Arguments
- names_targets
Character vector of target names to include in analysis. If NULL (default), analyzes all available targets. See
?targets::tar_meta()- targets_only
Logical (default TRUE). Whether to analyze only actual targets or also include metadata on functions and other global objects.
- complete_only
Logical (default FALSE). Whether to return only targets with complete metadata (no NA values in critical fields).
- store
Character string, path to the targets data store. See
?targets::tar_meta()for details.- tar_meta_raw
Optional data.frame. If provided, uses this metadata directly instead of calling
targets::tar_meta(). Useful for custom analyses or when working with pre-loaded metadata.- ...
Additional arguments passed to
ga_footprint(), such as:location_code: geographical location for carbon intensityn_cores: number of CPU cores usedTDP_per_core: thermal design power per corememory_ram: RAM memory in GBPUE: power usage effectiveness
Value
A list with the same structure as ga_footprint().
See ?ga_footprint for complete details on return values.
Examples
if (FALSE) { # \dontrun{
# Basic usage in a targets project directory
pipeline_footprint <- ga_targets()

# With specific hardware configuration
pipeline_footprint <- ga_targets(
  location_code = "FR",
  n_cores = 4,
  memory_ram = 16,
  PUE = 1.2
)

# Analyze specific targets only
pipeline_footprint <- ga_targets(
  names_targets = c("data_prep", "model_fit", "results"),
  add_storage_estimation = TRUE
)
} # }

# The next exemple emulate a mini-targets before to ask for tar_meta
tar_dir({ # tar_dir() runs code from a temp dir for CRAN.
  tar_script(
    {
      list(
        tar_target(
          name = waiting,
          command = Sys.sleep(2),
          description = "Sleep 2 seconds"
        ),
        tar_target(x, writeLines(
          targets::tar_option_get("error"),
          "error.txt"
        ))
      )
    },
    ask = FALSE
  )

  tar_make()
  tm <- tar_meta()

  res_gat <-
    ga_targets(
      tar_meta_raw = tm,
      n_cores = 6,
      TDP_per_core = 15.8,
      location_code = "FR",
      PUE = 2,
      add_storage_estimation = TRUE
    )

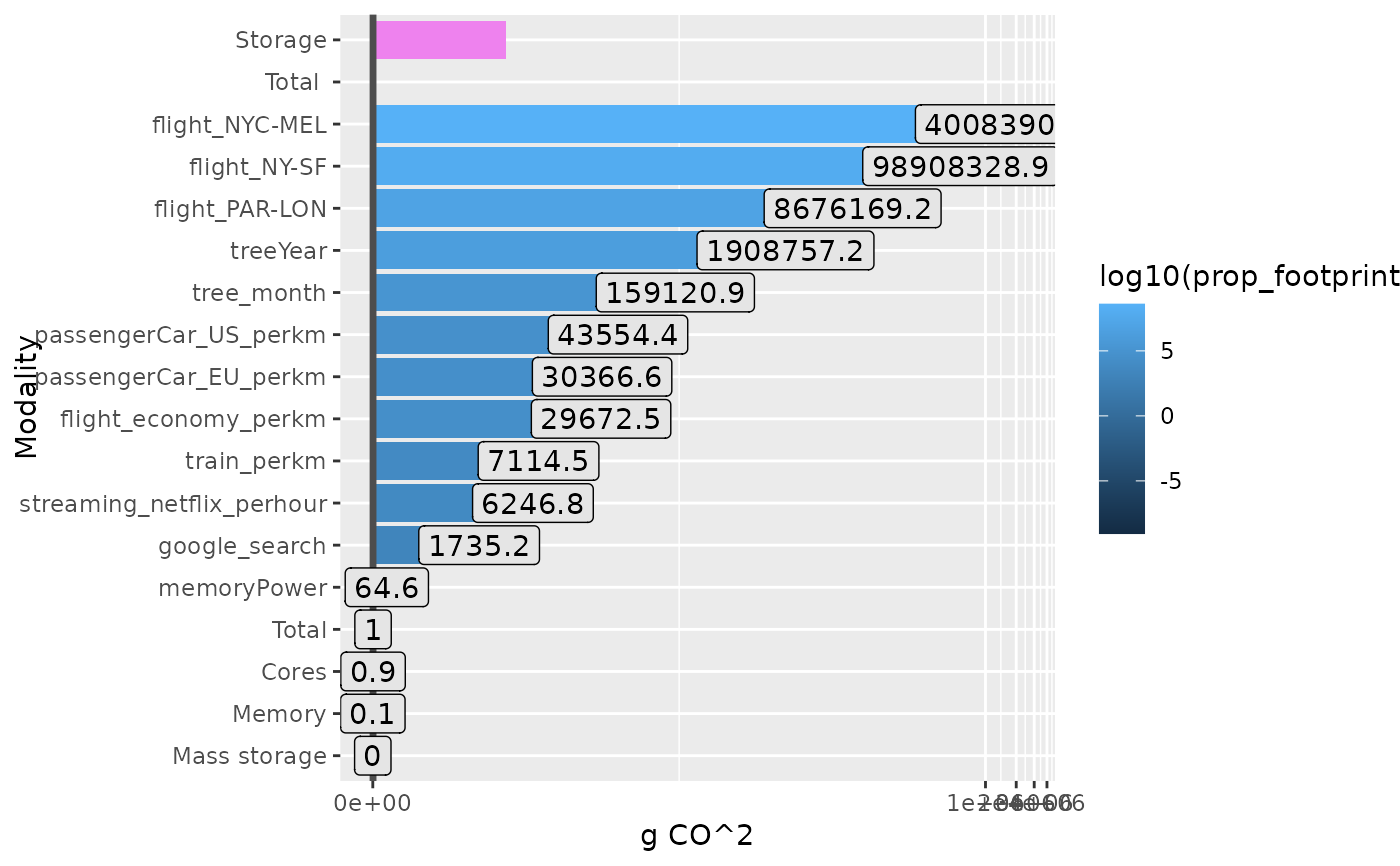
  ggplot(res_gat$ref_value, aes(
    y = reorder(variable, as.numeric(value)),
    x = as.numeric(value), fill = log10(prop_footprint)
  )) +
    geom_col() +
    geom_col(data = data.frame(
      variable = "Total ",
      value = res_gat$carbon_footprint_total_gCO2
    ), fill = "grey30") +
    geom_col(
      data = data.frame(
        variable = "Cores",
        value = res_gat$carbon_intensity * res_gat$power_draw_for_cores_kWh
      ),
      fill = "darkred"
    ) +
    geom_col(
      data = data.frame(
        variable = "Memory",
        value = res_gat$carbon_intensity * res_gat$power_draw_for_memory_kWh
      ),
      fill = "orange"
    ) +
    geom_col(
      data = data.frame(
        variable = "Storage",
        value = res_gat$carbon_intensity * res_gat$power_draw_per_gb
      ),
      fill = "violet"
    ) +
    scale_x_continuous(trans = "log1p") +
    geom_vline(
      xintercept = res_gat$carbon_footprint_total_gCO2,
      col = "grey30", lwd = 1.2
    ) +
    geom_label(aes(label = round(prop_footprint, 1)), fill = "grey90") +
    xlab("g CO^2") +
    ylab("Modality")
})
#> + x dispatched
#> ✔ x completed [1ms, 44 B]
#> + waiting dispatched
#> ✔ waiting completed [2s, 44 B]
#> ✔ ended pipeline [2.1s, 2 completed, 0 skipped]

