Computing metrics to test and quantify the non-random assembly of communities
ComIndex.RdComputing the moments of the trait distribution and other metrics to test and quantify the non-random assembly of communities.
Usage
ComIndex(traits = NULL, index = NULL, nullmodels = NULL,
  ind.plot = NULL, sp = NULL, com = NULL, SE = 0, namesindex = NULL,
  reg.pool = NULL, SE.reg.pool = NULL, nperm = 99, printprogress = TRUE,
  independantTraits = TRUE, type.sp.val = "count")

  # S3 method for class 'ComIndex'
plot(x, type = "normal",
  col.index = c("red", "purple", "olivedrab3"), add.conf = TRUE,
  color.cond = TRUE, val.quant = c(0.025, 0.975), ...)

  # S3 method for class 'ComIndex'
print(x, ...)

  # S3 method for class 'ComIndex'
summary(object, ...)
Arguments
- traits
Individual Matrix of traits with traits in column (or species matrix when using "com" instead of "ind.plot").
- index
A vector of function to apply to traits vectors in the form "mean(x, na.rm = TRUE)" or "range(x)", see examples for more complexe functions.
- nullmodels
A vector of names corresponding to null models tu use for each index. local (or 1) corresponds to a randomization of individual values within a given community. regional.ind (or 2) corresponds to randomization of individual values within region, ie within all the dataset. A value of regional.pop (or 2sp) corresponds to randomization of population values (each individual value are replaced by the mean value of it population) within region. Finally a value of regional.pop.prab (or 2sp.prab) mirror null model regional.pop but without taking indo account species abundance. For example, if nullmodels = c("local", "regional.ind"), the first index will be calculated on the null model local and the second index on the null model regional.ind.
If only one value is given, all the the null model will be determined by this value.
- ind.plot
Factor defining the name of the plot (site or community) in which the individual is.
- sp
Factor defining the species which the individual belong to.
- com
Community data matrix with species (or populations) in rows and sites in column. Use only if ind.plot = NULL. "traits" matrix and "com" matrix must have the same number of rows.
- SE
A single value or vector of standard errors associated with each traits. Especially allow to handle measurement errors. Not used with populational null model.
- namesindex
A vector of names for index.
- reg.pool
Regional pool data for traits. If not informed, traits is considere as the regional pool. This matrix need to be larger (more rows) than the matrix "traits". Use only for null model regional.ind.
- SE.reg.pool
A single value or vector of standard errors associated with each traits in each regional pool. Use only if reg.pool is used. Need to have the same dimension as reg.pool.
- nperm
Number of permutations. If NULL, only observed values are returned.
- printprogress
Logical value; print progress during the calculation or not.
- independantTraits
Logical value (default: TRUE). If independantTraits is true (default), each traits is sample independently in null models, if not, each lines of the matrix are randomized, keeping the relation (and trade-off) among traits.
- type.sp.val
Only if ind.plot = NULL. Either "count" or "abundance". Use abundance when one value or more in the com matrix are inferior to one. Using abundance is EXPERIMENTAL. This function round abundance to fit count data.
- x
An object of class ComIndex.
- object
An object of class ComIndex.
- type
Type of plot. Possible type = "simple", "simple_range", "normal", "barplot" and "bytraits".
- col.index
Vector of colors for index.
- add.conf
Logical value; Add confidence intervals or not.
- color.cond
Logical value; If color.cond = TRUE, color points indicate T-statistics values significatively different from the null model and grey points are not different from null model.
- val.quant
Numeric vectors of length 2, giving the quantile to calculate confidence interval. By default val.quant = c(0.025,0.975) for a bilateral test with alpha = 5%.
- ...
Any additional arguments are passed to the plot, print or summary function. See
plot.listofindexfor more arguments.
Details
Compute statistics (e.g. mean, range, CVNND and kurtosis) to test community assembly using null models. For each statistic this function returns observed values and the related null distribution. This function implement four null models which keep unchanged the number of individual per community. Model local (1) corresponds to randomization of individual values within community. Model regional.ind (2) corresponds to randomization of individual values within region. Model regional.pop (2sp) corresponds to randomization of population values within region. Model regional.pop.prab (2sp.prab) corresponds to randomization of population values within region but whitout taking into account for abundance.
In most cases, models local and regional.ind correspond to index at the individual level and the model regional.pop and regional.pop.prab to index at the species level (or any other aggregate variable like genus, family or functionnal group).
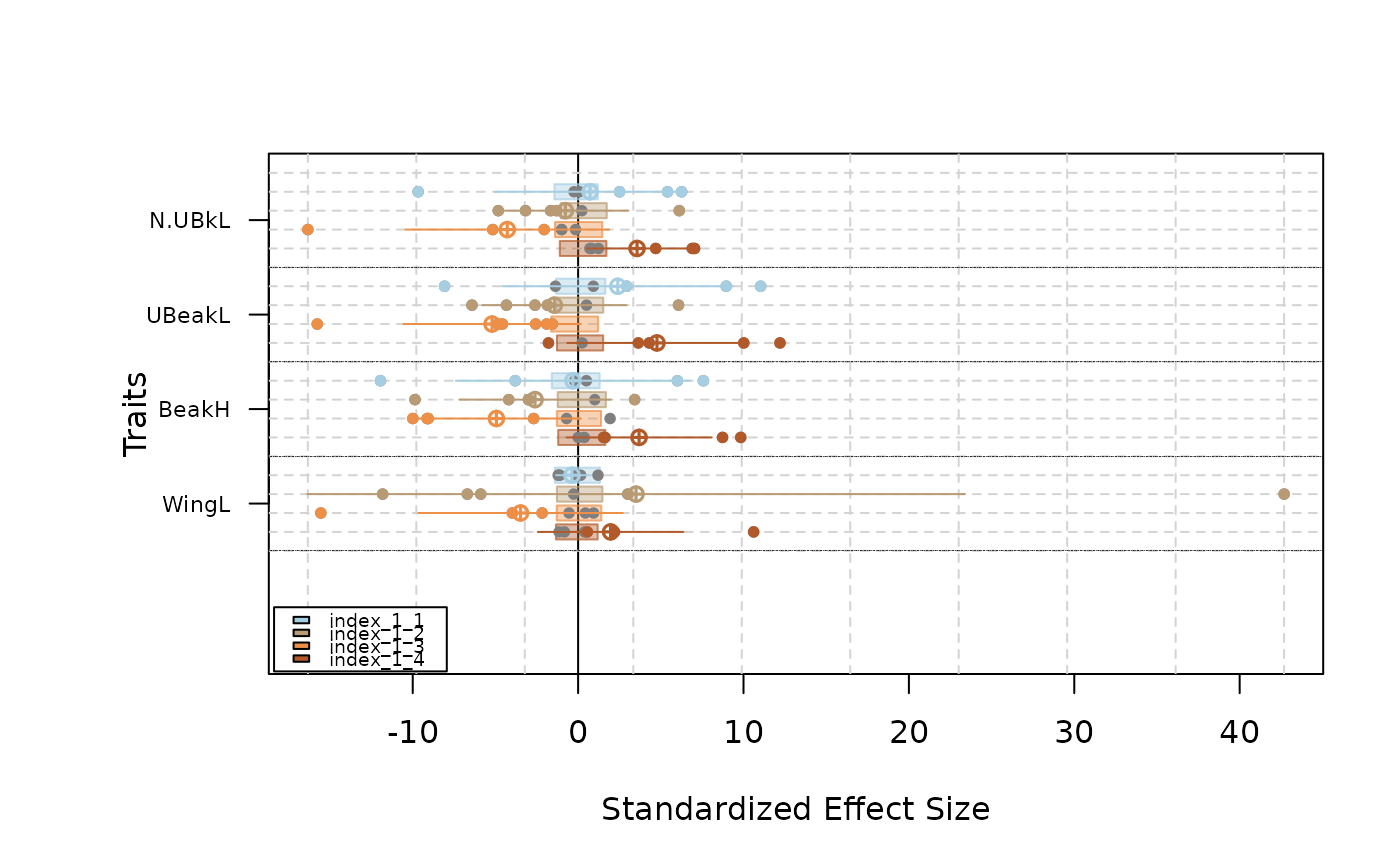
S3 method plot for class listofindex:
-Normal type plot means, standard deviations, ranges and confidence intervals of T-statistics.
-Simple_range type plot means, standard deviations and range of T-statistics
-Simple type plot T-statistics for each site and traits and the mean confidence intervals by traits
-Barplot type plot means, standard deviations and confidence intervals of T-statistics in a barplot fashion
-Bysites type plot each metrics for each sites
-Bytraits type plot each metrics for each traits
Value
An object of class "ComIndex" corresponding to a list of lists:
- $obs
List of observed values for each trait in each community. Each component of the list corresponds to a matrix containing the result for each custom function.
- $null
List of null values for each trait in each community. Each component of the list corresponds to an array containing the result of the permutations for each custom function.
- $list.index
List of index values and related null models. Internal use in other function. Traits in columns.
- $list.index.t
List of index values and related null models. Internal use in other function. Traits in rows.
- $sites_richness
Number of species per site.
- $namestraits
Names of traits.
- $traits
traits data
- $ind.plot
name of the plot in which the individual is
- $sp
groups (e.g. species) which the individual belong to
- $nullmodels
List of null models used for each indices.
- $call
call of the function Tstats
Examples
data(finch.ind)

# \donttest{
#Define the functions that will be calculating
funct<-c("mean(x, na.rm = TRUE)", "kurtosis(x, na.rm = TRUE)",
     "max(x, na.rm = TRUE) - min(x, na.rm = TRUE)" )

#Test against the null model regional.ind
res.finch.sp_regional.ind<-ComIndex(traits = traits.finch, index = funct, sp = sp.finch,
                           nullmodels = "regional.ind", ind.plot = ind.plot.finch,
                            nperm = 9, print = FALSE)
#> Warning: This function exclude 1137 Na value

#Test against the null model regional.pop
#Individuals values are transformed in populational values
res.finch.sp_regional.pop<-ComIndex(traits = traits.finch, index = funct, sp = sp.finch,
               nullmodels = "regional.pop", ind.plot = ind.plot.finch,
               nperm = 9, print = FALSE)
#> Warning: This function exclude 1137 Na value


#We can calculate index with or without intraspecific variance.

#calculate  of means by population (name_sp_site is a name of a population)
#determine the site for each population (sites_bypop)

name_sp_sites = paste(sp.finch, ind.plot.finch,sep = "_")
traits.by.pop<-apply(traits.finch, 2 ,
           function (x) tapply(x, name_sp_sites, mean, na.rm = TRUE))

sites_bypop<-lapply(strsplit(paste(rownames(traits.by.pop), sep = "_"), split = "_"),
          function(x) x[3])

#New list of function "funct"

funct.1<-c("tapply(x, ind.plot.finch, function(x) mean(x, na.rm = TRUE))",
     "tapply(x, ind.plot.finch, function(x) kurtosis(x, na.rm = TRUE))",
     "tapply(x, ind.plot.finch, function(x) max(x, na.rm = TRUE)-min(x, na.rm = TRUE))",
     "tapply(x, ind.plot.finch, function(x) CVNND(x, na.rm = TRUE))" )

fact<-unlist(sites_bypop)
funct.2<-c("tapply(x, fact, function(x) mean(x, na.rm = TRUE))",
          "tapply(x, fact, function(x) kurtosis(x, na.rm = TRUE))",
          "tapply(x, fact, function(x) max(x, na.rm = TRUE)-min(x, na.rm = TRUE))",
          "tapply(x, fact, function(x) CVNND(x, na.rm = TRUE))")


res.finch.withIV<-ComIndex(traits = traits.finch, index = funct.1,
               sp = sp.finch, nullmodels = "regional.ind",
               ind.plot = ind.plot.finch, nperm = 9, print = FALSE)
#> Warning: This function exclude 1137 Na value

res.finch.withoutIV<-ComIndex(traits = traits.finch, index = funct.2,
               sp = sp.finch, nullmodels = "regional.pop",
               ind.plot = ind.plot.finch, nperm = 9, print = FALSE)
#> Warning: This function exclude 1137 Na value
#> Error in eval(parse(text = functionindex)): object 'fact' not found

#ComIndex class are associated to S3 methods plot, print and summary.

res.finch.withIV
#> 	#################################
#> 	# Community metrics calculation #
#> 	#################################
#> class: ComIndex
#> $call: ComIndex(traits = traits.finch, index = funct.1, nullmodels = "regional.ind",
#>     ind.plot = ind.plot.finch, sp = sp.finch, nperm = 9, printprogress = FALSE)
#>
#> ###############
#> $obs: list of observed values
#> 	$tapply(x, ind.plot.finch, function(x) mean(x, na.rm = TRUE))
#> 	$tapply(x, ind.plot.finch, function(x) kurtosis(x, na.rm = TRUE))
#> 	$tapply(x, ind.plot.finch, function(x) max(x, na.rm = TRUE)-min(x, na.rm = TRUE))
#> 	$tapply(x, ind.plot.finch, function(x) CVNND(x, na.rm = TRUE))
#>
#> ###############
#> $null: list of null values, number of permutations: 9
#> 	$tapply(x, ind.plot.finch, function(x) mean(x, na.rm = TRUE))_nm ... null model = regional.ind
#> 	$tapply(x, ind.plot.finch, function(x) kurtosis(x, na.rm = TRUE))_nm ... null model = regional.ind
#> 	$tapply(x, ind.plot.finch, function(x) max(x, na.rm = TRUE)-min(x, na.rm = TRUE))_nm ... null model = regional.ind
#> 	$tapply(x, ind.plot.finch, function(x) CVNND(x, na.rm = TRUE))_nm ... null model = regional.ind
#>
#> ###############
#> data used
#>   data      class  dim    content
#> 1 $traits   matrix 2513,4 traits data
#> 2 $ind.plot factor 2513   name of the plot in which the individual is
#> 3 $sp       factor 2513   individuals' groups (e.g. species)
#>
#> ###############
#> others
#> 	$namestraits: 4 traits
#> [1] "WingL"  "BeakH"  "UBeakL" "N.UBkL"
#>
#> 	$sites_richness:
#> 	    DMaj    EspHd FlorChrl  GnovTwr MrchBndl SCruInde
#>       50      267      981      258      270      687
#>
summary(res.finch.withIV)
#> [1] "Observed values"
#> $`tapply(x, ind.plot.finch, function(x) mean(x, na.rm = TRUE))`
#>      WingL           BeakH            UBeakL          N.UBkL
#>  Min.   :66.96   Min.   : 9.715   Min.   :14.82   Min.   :10.11
#>  1st Qu.:67.61   1st Qu.: 9.989   1st Qu.:15.41   1st Qu.:10.74
#>  Median :67.72   Median :10.367   Median :16.44   Median :11.04
#>  Mean   :67.68   Mean   :10.619   Mean   :16.66   Mean   :11.12
#>  3rd Qu.:67.79   3rd Qu.:11.360   3rd Qu.:17.98   3rd Qu.:11.57
#>  Max.   :68.32   Max.   :11.711   Max.   :18.68   Max.   :12.15
#>
#> $`tapply(x, ind.plot.finch, function(x) kurtosis(x, na.rm = TRUE))`
#>      WingL             BeakH             UBeakL            N.UBkL
#>  Min.   :-1.4661   Min.   :-1.3600   Min.   :-1.5999   Min.   :-1.7517
#>  1st Qu.:-1.2523   1st Qu.:-0.6418   1st Qu.:-1.1848   1st Qu.:-1.4487
#>  Median :-0.8208   Median :-0.2972   Median :-1.0891   Median :-1.0828
#>  Mean   :-0.6218   Mean   :-0.1105   Mean   :-0.5643   Mean   :-0.7396
#>  3rd Qu.:-0.2742   3rd Qu.: 0.6464   3rd Qu.:-0.8763   3rd Qu.:-0.9456
#>  Max.   : 0.8648   Max.   : 1.0872   Max.   : 2.4142   Max.   : 1.9503
#>
#> $`tapply(x, ind.plot.finch, function(x) max(x, na.rm = TRUE)-min(x, na.rm = TRUE))`
#>      WingL           BeakH           UBeakL          N.UBkL
#>  Min.   :11.00   Min.   : 4.30   Min.   : 8.70   Min.   : 6.500
#>  1st Qu.:34.25   1st Qu.:14.65   1st Qu.:11.12   1st Qu.: 8.875
#>  Median :35.50   Median :16.05   Median :12.60   Median :10.050
#>  Mean   :31.83   Mean   :14.67   Mean   :11.93   Mean   : 9.333
#>  3rd Qu.:36.75   3rd Qu.:17.52   3rd Qu.:13.25   3rd Qu.:10.325
#>  Max.   :38.00   Max.   :19.40   Max.   :13.60   Max.   :10.500
#>
#> $`tapply(x, ind.plot.finch, function(x) CVNND(x, na.rm = TRUE))`
#>      WingL            BeakH            UBeakL           N.UBkL
#>  Min.   : 7.071   Min.   : 2.960   Min.   : 2.689   Min.   : 2.700
#>  1st Qu.: 7.611   1st Qu.: 3.322   1st Qu.: 3.231   1st Qu.: 4.034
#>  Median :12.018   Median : 3.628   Median : 3.969   Median : 5.938
#>  Mean   :14.282   Mean   : 5.966   Mean   : 6.392   Mean   :10.303
#>  3rd Qu.:15.977   3rd Qu.: 5.178   3rd Qu.: 5.052   3rd Qu.:11.021
#>  Max.   :31.145   Max.   :16.664   Max.   :19.325   Max.   :31.129
#>
#> [1] "null values"
#> $`tapply(x, ind.plot.finch, function(x) mean(x, na.rm = TRUE))`
#>    Min. 1st Qu.  Median    Mean 3rd Qu.    Max.
#>   9.571  10.525  13.113  26.235  29.372  68.803
#>
#> $`tapply(x, ind.plot.finch, function(x) kurtosis(x, na.rm = TRUE))`
#>      Min.   1st Qu.    Median      Mean   3rd Qu.      Max.
#> -1.367139 -0.917785 -0.568552 -0.426036 -0.007055  1.343496
#>
#> $`tapply(x, ind.plot.finch, function(x) max(x, na.rm = TRUE)-min(x, na.rm = TRUE))`
#>    Min. 1st Qu.  Median    Mean 3rd Qu.    Max.
#>    8.50   11.20   15.45   19.88   23.02   39.00
#>
#> $`tapply(x, ind.plot.finch, function(x) CVNND(x, na.rm = TRUE))`
#>    Min. 1st Qu.  Median    Mean 3rd Qu.    Max.    NA's
#>  0.7009  2.5260  3.7846  6.2333  7.7401 31.0644       4
#>
plot(res.finch.withIV)

plot(res.finch.withoutIV)
#> Error: object 'res.finch.withoutIV' not found

plot(as.listofindex(list(res.finch.withIV, res.finch.withoutIV)))
#> Error: object 'res.finch.withoutIV' not found
# }
plot(res.finch.withoutIV)
#> Error: object 'res.finch.withoutIV' not found
plot(as.listofindex(list(res.finch.withIV, res.finch.withoutIV)))
#> Error: object 'res.finch.withoutIV' not found
# }