Make violin plot of MiteMap data
vioplot_mitemap.RdMake violin plot of MiteMap data
Arguments
- MiteMap
(required) The result of import_mitemap
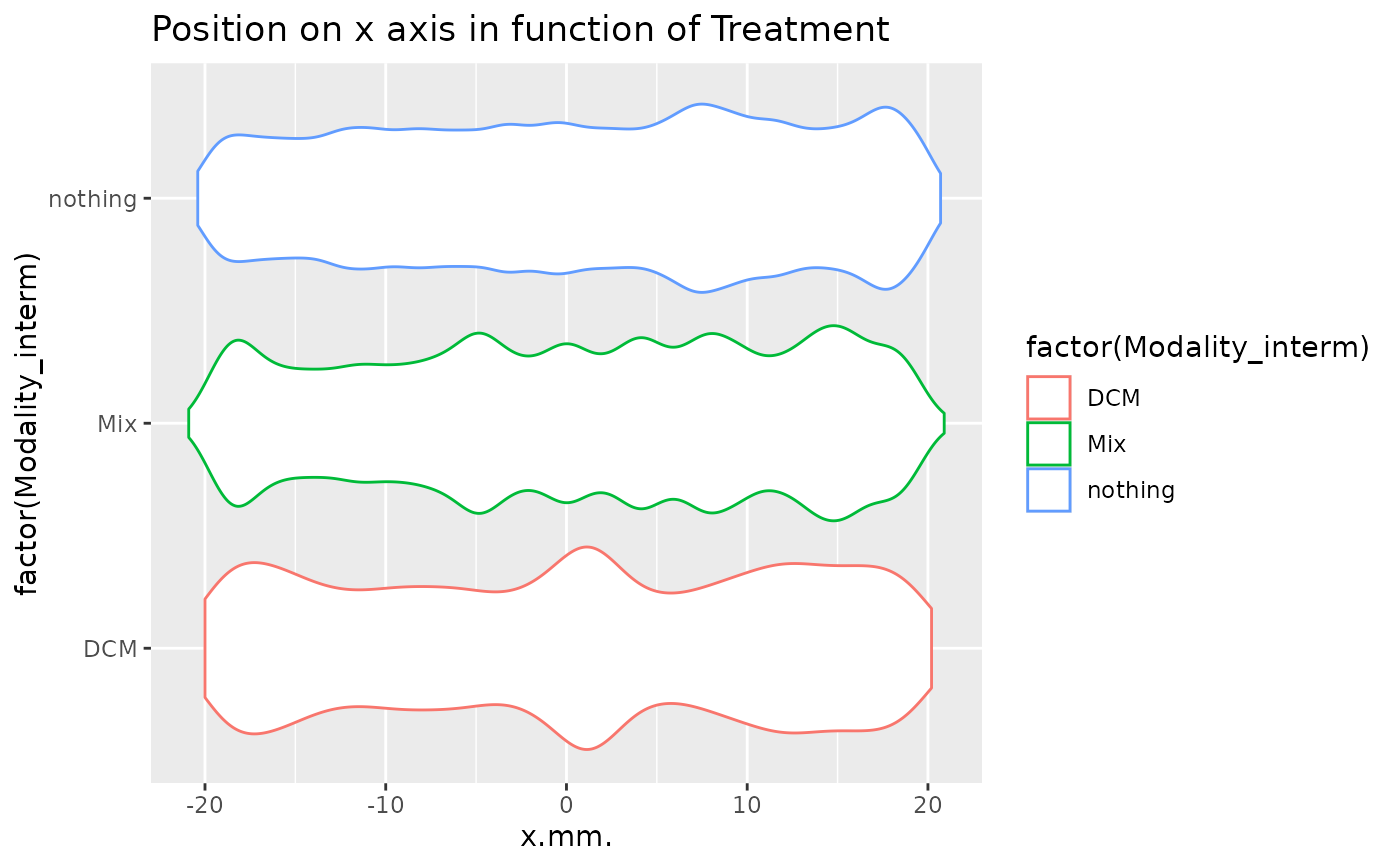
- factor
: A name of column present in the MiteMap to separate violin plot.
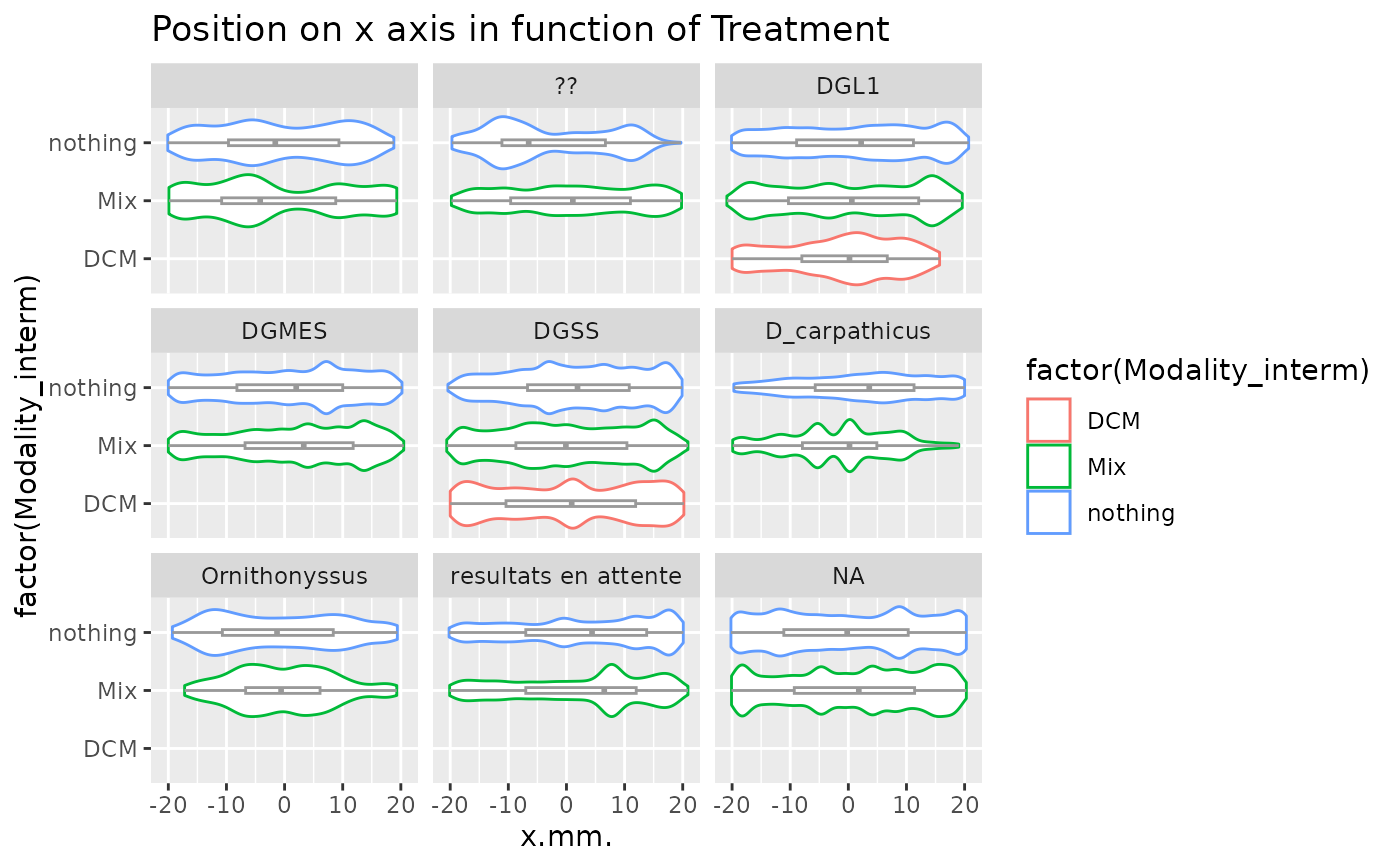
- wrap
: A name of column present in the MiteMap to wrap violin plot.
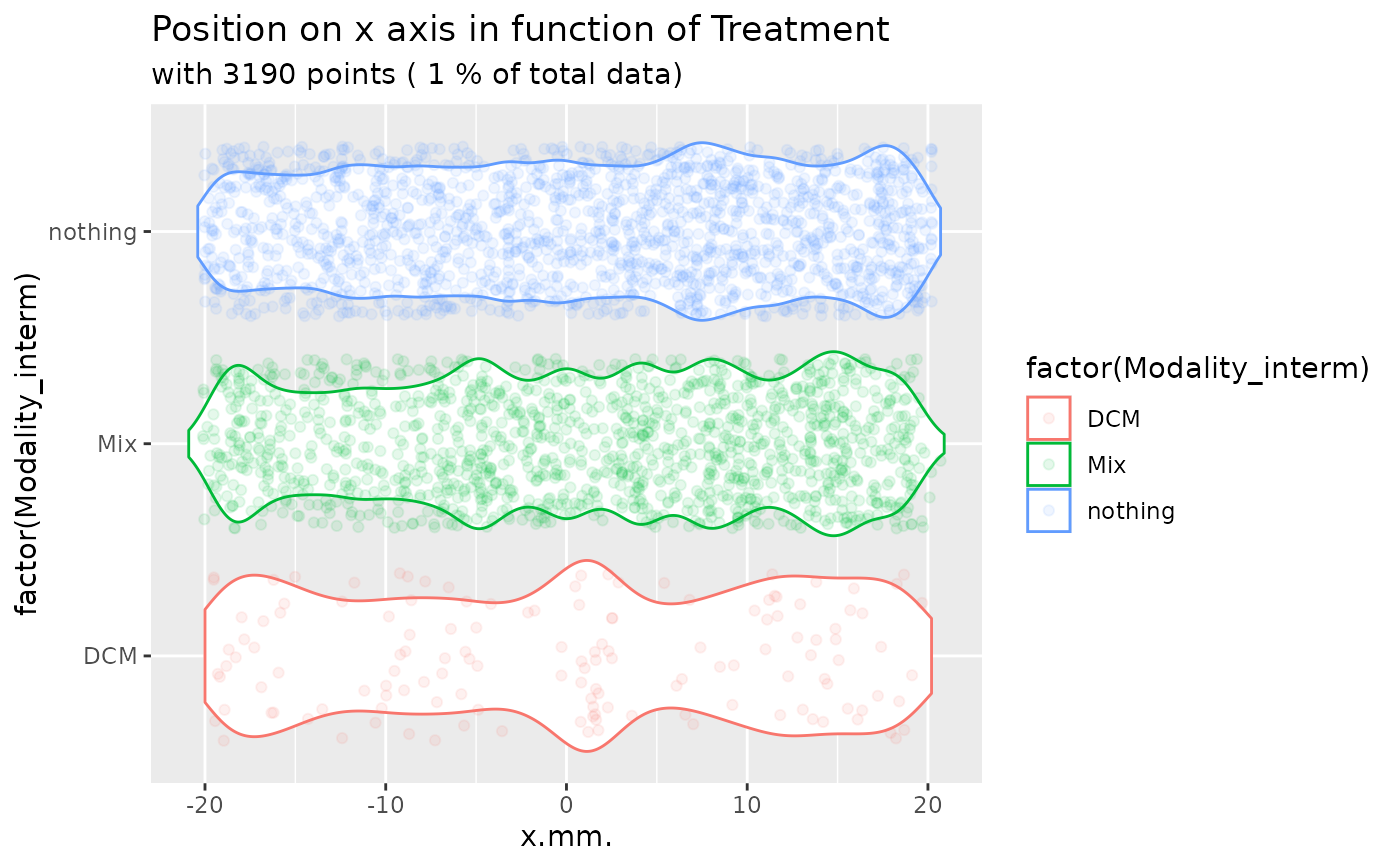
- prop_points
(numeric between 0 and 1, default=NULL) If not NULL, a proportion of points is randomly sampled and added to the violin plot. This can help to visualize the data distribution, especially with large datasets.