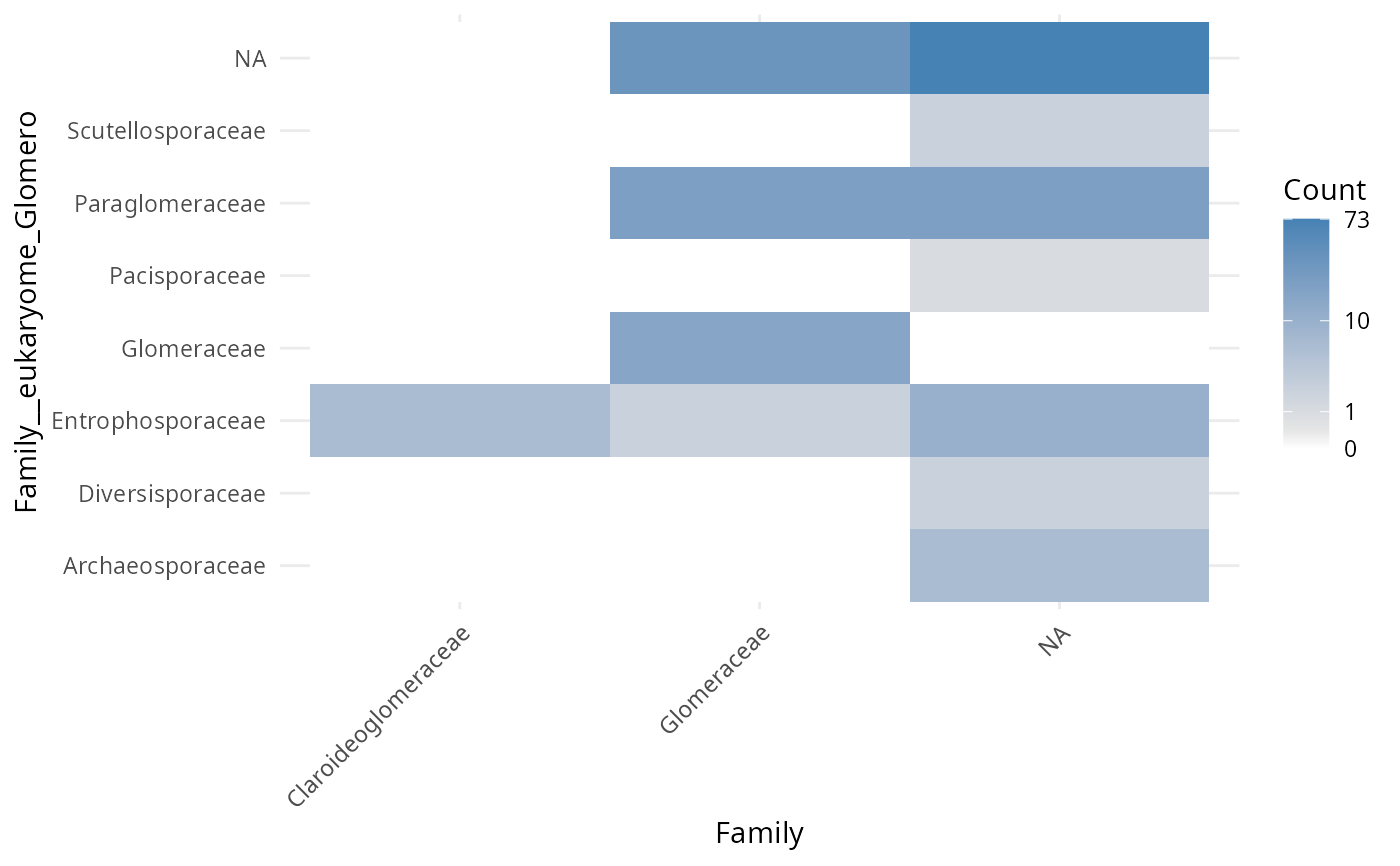
Useful to compare taxonomy from two different source/db/algo side-by-side. Each cell shows the number of taxa assigned to the combination of the two ranks.
Usage
tc_heatmap(
  physeq,
  rank_1,
  rank_2,
  zero_color = "white",
  low_color = "grey90",
  high_color = "steelblue",
  na_value = "grey60",
  merge_sample_by = NULL,
  log10trans = TRUE
)
Arguments
- physeq
(required) A
phyloseq-classobject obtained using thephyloseqpackage.- rank_1
(character or integer) Define the first taxonomic rank as the number or the name of the column in tax_table slot.
- rank_2
(character or integer) Define the second taxonomic rank as the number or the name of the column in tax_table slot.
- zero_color
(character, default "white") Color for cells with a count of zero.
- low_color
(character, default "grey90") Color for the lowest non-zero count cells.
- high_color
(character, default "steelblue") Color for high count cells.
- na_value
(character, default "grey60") Color for NA count cells.
- merge_sample_by
(character, default NULL) A vector to determine which samples to merge using
merge_samples2()function. Need to be inphyseq@sam_data.- log10trans
(logical, default TRUE) If TRUE, apply a log1p transformation to the fill scale. Legend labels always show real counts.
Examples
tc_heatmap(
  subset_taxa_pq(Glom_otu, taxa_sums(Glom_otu) > 5000),
  rank_1 = "Family",
  rank_2 = "Family__eukaryome_Glomero"
)
#> Cleaning suppress 0 taxa (  ) and 1 sample(s) ( samp_Blanc-PCR-racines ).
#> Number of non-matching ASV 0
#> Number of matching ASV 1147
#> Number of filtered-out ASV 955
#> Number of kept ASV 192
#> Number of kept samples 443

if (FALSE) { # \dontrun{
tc_heatmap(Glom_otu, rank_1 = 5, rank_2 = 13)
tc_heatmap(Glom_otu, rank_1 = "Genus", rank_2 = "Genus__eukaryome_Glomero",
  high_color = "darkred", zero_color = "black", low_color="pink")
} # }
if (FALSE) { # \dontrun{
tc_heatmap(Glom_otu, rank_1 = 5, rank_2 = 13)
tc_heatmap(Glom_otu, rank_1 = "Genus", rank_2 = "Genus__eukaryome_Glomero",
high_color = "darkred", zero_color = "black", low_color="pink")
} # }