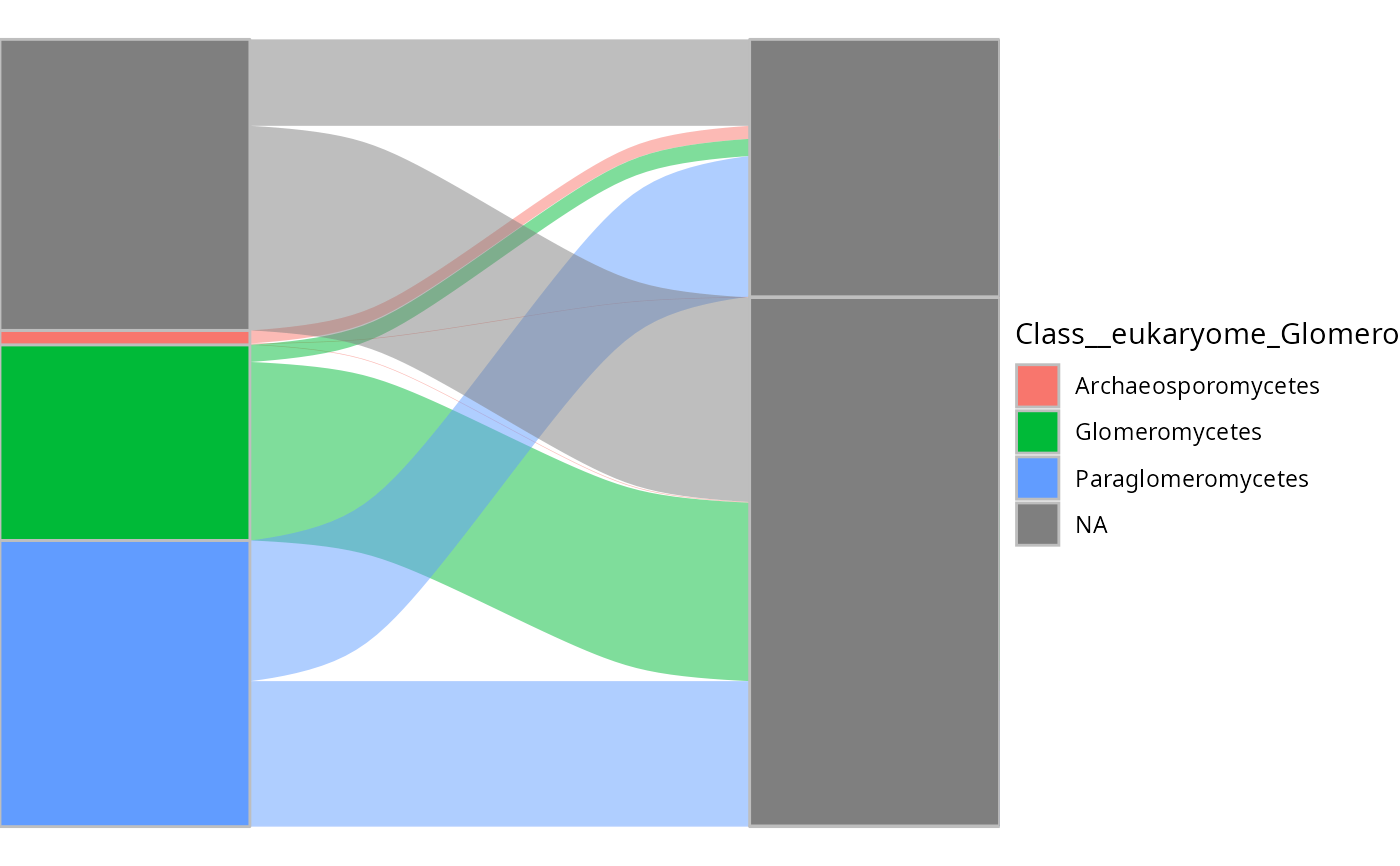
Creates a Sankey (alluvial) diagram to visualize the correspondence between two taxonomic ranks. Useful for comparing taxonomy assignments from different databases or algorithms.
Arguments
- physeq
(required) A
phyloseq-classobject obtained using thephyloseqpackage.- rank_1
(character or integer, required) Define the first taxonomic rank as the number or the name of the column in tax_table slot.
- rank_2
(character or integer, required) Define the second taxonomic rank as the number or the name of the column in tax_table slot.
- fill_by
(character, default "rank_1") Which rank to use for fill color. Either "rank_1" or "rank_2".
Examples
tc_sankey(
Glom_otu,
"Class__eukaryome_Glomero",
"Class"
)
#> Warning: Some strata appear at multiple axes.
#> Warning: Some strata appear at multiple axes.
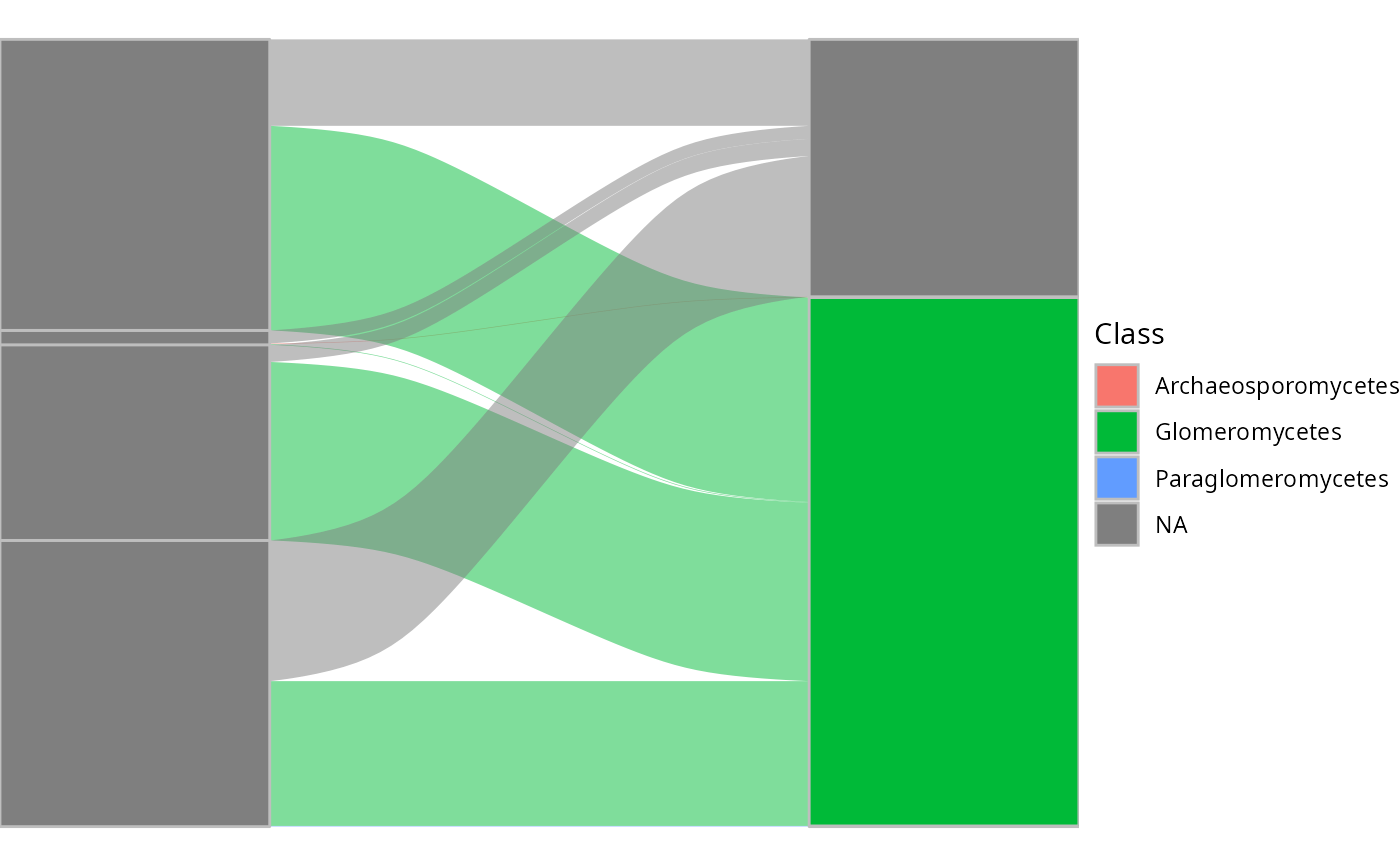
 # Fill by rank_2 instead
tc_sankey(
Glom_otu,
"Class__eukaryome_Glomero",
"Class",
fill_by = "rank_2"
)
#> Warning: Some strata appear at multiple axes.
#> Warning: Some strata appear at multiple axes.
# Fill by rank_2 instead
tc_sankey(
Glom_otu,
"Class__eukaryome_Glomero",
"Class",
fill_by = "rank_2"
)
#> Warning: Some strata appear at multiple axes.
#> Warning: Some strata appear at multiple axes.
 if (FALSE) { # \dontrun{
# Add labels to the strata
tc_sankey(Glom_otu, "Class__eukaryome_Glomero", "Class") +
geom_label(
stat = "stratum",
aes(label = after_stat(stratum)),
na.rm = TRUE
) +
theme(legend.position = "none")
} # }
if (FALSE) { # \dontrun{
# Add labels to the strata
tc_sankey(Glom_otu, "Class__eukaryome_Glomero", "Class") +
geom_label(
stat = "stratum",
aes(label = after_stat(stratum)),
na.rm = TRUE
) +
theme(legend.position = "none")
} # }