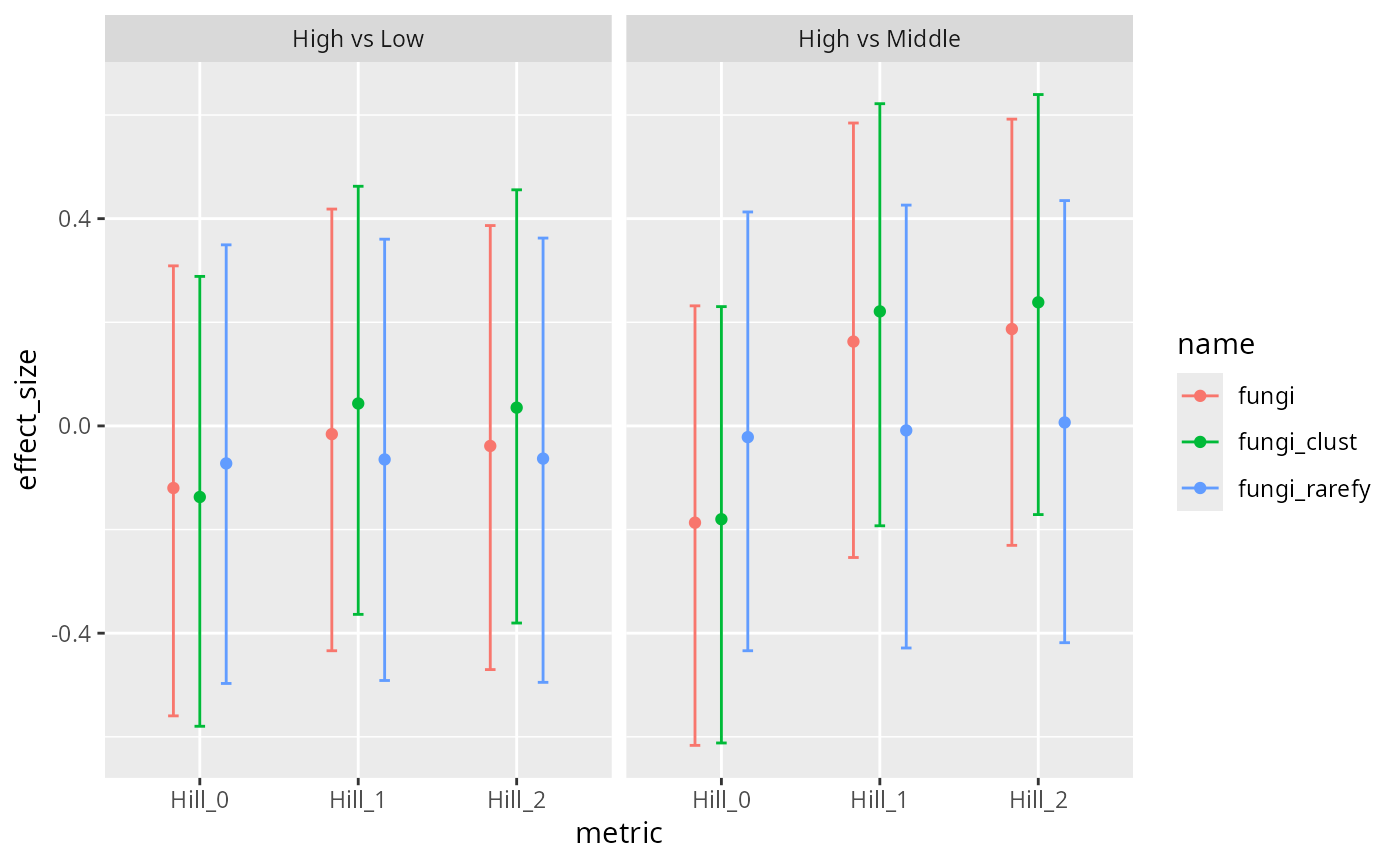
Estimation statistics for categorical comparisons on a list_phyloseq
Source:R/estim_lpq.R
estim_diff_lpq.RdApplies estim_diff_pq() to each phyloseq object in a list_phyloseq
and combines the results. This allows comparing estimation statistics
across different bioinformatic pipelines or parameter settings.
Arguments
- x
(required) A list_phyloseq object.
- fact
(character, required) The name of a categorical column in
sample_datato use as the grouping factor. Must be present in all phyloseq objects.- ...
Additional arguments passed to
estim_diff_pq().- verbose
(logical, default TRUE) If TRUE, print progress messages.
Value
A list of class "estim_diff_lpq_result" with components:
- results
A named list of
estim_diff_pq_resultobjects (one per phyloseq)- summary
A tibble combining all summaries with an additional
namecolumn identifying the source phyloseq
Examples
# Subset to the 80 most abundant taxa to keep the example fast
data_fungi_small <- prune_taxa(
  names(sort(taxa_sums(data_fungi), decreasing = TRUE))[1:80],
  data_fungi
)
data_fungi_small <- clean_pq(prune_samples(
  sample_sums(data_fungi_small) >= 500, data_fungi_small
))

lpq <- list_phyloseq(
  list(
    fungi = data_fungi_small,
    fungi_clust = postcluster_pq(data_fungi_small),
    fungi_rarefy = rarefy_even_depth(data_fungi_small),
    fungi_with_less_otu_in_High =  multiply_counts_pq(data_fungi_small,
      fact = "Height", prop=0.8,
      conditions = "High",
      multipliers = 0)
  ),
  same_bioinfo_pipeline = FALSE
)
#> Partitioning sequences by 4-mer similarity:
#> ================================================================================
#>
#> Time difference of 0.04 secs
#>
#> Sorting by relatedness within 80 groups:
#> Clustering sequences by 9-mer similarity:
#> ================================================================================
#>
#> Time difference of 0.28 secs
#>
#> Clusters via relatedness sorting: 100% (0% exclusively)
#> Clusters via rare 4-mers: 100% (0% exclusively)
#> Estimated clustering effectiveness: 100%
#>
#> You set `rngseed` to FALSE. Make sure you've set & recorded
#>  the random seed of your session for reproducibility.
#> See `?set.seed`
#> ...
#> Modified 64 taxa in 28 matched samples
#> ℹ Building summary table for 4 phyloseq objects...
#> ℹ Computing comparison characteristics...
#> ℹ Checking sample and taxa overlap...
#> ℹ Detected comparison type: ROBUSTNESS
#> ℹ 127 common samples, 67 common taxa
#> ✔ list_phyloseq created (ROBUSTNESS)

# 1000 resamples for speed you must increase it
results <- estim_diff_lpq(lpq, fact = "Height", resamples=1000)
#> Running estimation statistics (categorical) on 4 phyloseq objects
#> Factor: Height
#> → Processing: fungi
#> ! Function arguments cannot be checked because the package divent is not attached.
#> → Add `CheckArguments=FALSE` to suppress this warning or run `library('divent')`.
#> ! Function arguments cannot be checked because the package divent is not attached.
#> → Add `CheckArguments=FALSE` to suppress this warning or run `library('divent')`.
#> ! Function arguments cannot be checked because the package divent is not attached.
#> → Add `CheckArguments=FALSE` to suppress this warning or run `library('divent')`.
#> ! Function arguments cannot be checked because the package divent is not attached.
#> → Add `CheckArguments=FALSE` to suppress this warning or run `library('divent')`.
#> ! Function arguments cannot be checked because the package divent is not attached.
#> → Add `CheckArguments=FALSE` to suppress this warning or run `library('divent')`.
#> ! Function arguments cannot be checked because the package divent is not attached.
#> → Add `CheckArguments=FALSE` to suppress this warning or run `library('divent')`.
#> ! Function arguments cannot be checked because the package divent is not attached.
#> → Add `CheckArguments=FALSE` to suppress this warning or run `library('divent')`.
#> ! Function arguments cannot be checked because the package divent is not attached.
#> → Add `CheckArguments=FALSE` to suppress this warning or run `library('divent')`.
#> ! Function arguments cannot be checked because the package divent is not attached.
#> → Add `CheckArguments=FALSE` to suppress this warning or run `library('divent')`.
#> ! Function arguments cannot be checked because the package divent is not attached.
#> → Add `CheckArguments=FALSE` to suppress this warning or run `library('divent')`.
#> ! Function arguments cannot be checked because the package divent is not attached.
#> → Add `CheckArguments=FALSE` to suppress this warning or run `library('divent')`.
#> ! Function arguments cannot be checked because the package divent is not attached.
#> → Add `CheckArguments=FALSE` to suppress this warning or run `library('divent')`.
#> ! Function arguments cannot be checked because the package divent is not attached.
#> → Add `CheckArguments=FALSE` to suppress this warning or run `library('divent')`.
#> ! Function arguments cannot be checked because the package divent is not attached.
#> → Add `CheckArguments=FALSE` to suppress this warning or run `library('divent')`.
#> ! Function arguments cannot be checked because the package divent is not attached.
#> → Add `CheckArguments=FALSE` to suppress this warning or run `library('divent')`.
#> ! Function arguments cannot be checked because the package divent is not attached.
#> → Add `CheckArguments=FALSE` to suppress this warning or run `library('divent')`.
#> ! Function arguments cannot be checked because the package divent is not attached.
#> → Add `CheckArguments=FALSE` to suppress this warning or run `library('divent')`.
#> ! Function arguments cannot be checked because the package divent is not attached.
#> → Add `CheckArguments=FALSE` to suppress this warning or run `library('divent')`.
#> ! Function arguments cannot be checked because the package divent is not attached.
#> → Add `CheckArguments=FALSE` to suppress this warning or run `library('divent')`.
#> ! Function arguments cannot be checked because the package divent is not attached.
#> → Add `CheckArguments=FALSE` to suppress this warning or run `library('divent')`.
#> ! Function arguments cannot be checked because the package divent is not attached.
#> → Add `CheckArguments=FALSE` to suppress this warning or run `library('divent')`.
#> ! Function arguments cannot be checked because the package divent is not attached.
#> → Add `CheckArguments=FALSE` to suppress this warning or run `library('divent')`.
#> ! Function arguments cannot be checked because the package divent is not attached.
#> → Add `CheckArguments=FALSE` to suppress this warning or run `library('divent')`.
#> ! Function arguments cannot be checked because the package divent is not attached.
#> → Add `CheckArguments=FALSE` to suppress this warning or run `library('divent')`.
#> ! Function arguments cannot be checked because the package divent is not attached.
#> → Add `CheckArguments=FALSE` to suppress this warning or run `library('divent')`.
#> ! Function arguments cannot be checked because the package divent is not attached.
#> → Add `CheckArguments=FALSE` to suppress this warning or run `library('divent')`.
#> ! Function arguments cannot be checked because the package divent is not attached.
#> → Add `CheckArguments=FALSE` to suppress this warning or run `library('divent')`.
#> ! Function arguments cannot be checked because the package divent is not attached.
#> → Add `CheckArguments=FALSE` to suppress this warning or run `library('divent')`.
#> ! Function arguments cannot be checked because the package divent is not attached.
#> → Add `CheckArguments=FALSE` to suppress this warning or run `library('divent')`.
#> ! Function arguments cannot be checked because the package divent is not attached.
#> → Add `CheckArguments=FALSE` to suppress this warning or run `library('divent')`.
#> ! Function arguments cannot be checked because the package divent is not attached.
#> → Add `CheckArguments=FALSE` to suppress this warning or run `library('divent')`.
#> ! Function arguments cannot be checked because the package divent is not attached.
#> → Add `CheckArguments=FALSE` to suppress this warning or run `library('divent')`.
#> ! Function arguments cannot be checked because the package divent is not attached.
#> → Add `CheckArguments=FALSE` to suppress this warning or run `library('divent')`.
#> ! Function arguments cannot be checked because the package divent is not attached.
#> → Add `CheckArguments=FALSE` to suppress this warning or run `library('divent')`.
#> ! Function arguments cannot be checked because the package divent is not attached.
#> → Add `CheckArguments=FALSE` to suppress this warning or run `library('divent')`.
#> ! Function arguments cannot be checked because the package divent is not attached.
#> → Add `CheckArguments=FALSE` to suppress this warning or run `library('divent')`.
#> ! Function arguments cannot be checked because the package divent is not attached.
#> → Add `CheckArguments=FALSE` to suppress this warning or run `library('divent')`.
#> ! Function arguments cannot be checked because the package divent is not attached.
#> → Add `CheckArguments=FALSE` to suppress this warning or run `library('divent')`.
#> ! Function arguments cannot be checked because the package divent is not attached.
#> → Add `CheckArguments=FALSE` to suppress this warning or run `library('divent')`.
#> ! Function arguments cannot be checked because the package divent is not attached.
#> → Add `CheckArguments=FALSE` to suppress this warning or run `library('divent')`.
#> ! Function arguments cannot be checked because the package divent is not attached.
#> → Add `CheckArguments=FALSE` to suppress this warning or run `library('divent')`.
#> ! Function arguments cannot be checked because the package divent is not attached.
#> → Add `CheckArguments=FALSE` to suppress this warning or run `library('divent')`.
#> ! Function arguments cannot be checked because the package divent is not attached.
#> → Add `CheckArguments=FALSE` to suppress this warning or run `library('divent')`.
#> ! Function arguments cannot be checked because the package divent is not attached.
#> → Add `CheckArguments=FALSE` to suppress this warning or run `library('divent')`.
#> ! Function arguments cannot be checked because the package divent is not attached.
#> → Add `CheckArguments=FALSE` to suppress this warning or run `library('divent')`.
#> ! Function arguments cannot be checked because the package divent is not attached.
#> → Add `CheckArguments=FALSE` to suppress this warning or run `library('divent')`.
#> ! Function arguments cannot be checked because the package divent is not attached.
#> → Add `CheckArguments=FALSE` to suppress this warning or run `library('divent')`.
#> ! Function arguments cannot be checked because the package divent is not attached.
#> → Add `CheckArguments=FALSE` to suppress this warning or run `library('divent')`.
#> ! Function arguments cannot be checked because the package divent is not attached.
#> → Add `CheckArguments=FALSE` to suppress this warning or run `library('divent')`.
#> ! Function arguments cannot be checked because the package divent is not attached.
#> → Add `CheckArguments=FALSE` to suppress this warning or run `library('divent')`.
#> ! Function arguments cannot be checked because the package divent is not attached.
#> → Add `CheckArguments=FALSE` to suppress this warning or run `library('divent')`.
#> ! Function arguments cannot be checked because the package divent is not attached.
#> → Add `CheckArguments=FALSE` to suppress this warning or run `library('divent')`.
#> ! Function arguments cannot be checked because the package divent is not attached.
#> → Add `CheckArguments=FALSE` to suppress this warning or run `library('divent')`.
#> ! Function arguments cannot be checked because the package divent is not attached.
#> → Add `CheckArguments=FALSE` to suppress this warning or run `library('divent')`.
#> ! Function arguments cannot be checked because the package divent is not attached.
#> → Add `CheckArguments=FALSE` to suppress this warning or run `library('divent')`.
#> ! Function arguments cannot be checked because the package divent is not attached.
#> → Add `CheckArguments=FALSE` to suppress this warning or run `library('divent')`.
#> ! Function arguments cannot be checked because the package divent is not attached.
#> → Add `CheckArguments=FALSE` to suppress this warning or run `library('divent')`.
#> ! Function arguments cannot be checked because the package divent is not attached.
#> → Add `CheckArguments=FALSE` to suppress this warning or run `library('divent')`.
#> ! Function arguments cannot be checked because the package divent is not attached.
#> → Add `CheckArguments=FALSE` to suppress this warning or run `library('divent')`.
#> ! Function arguments cannot be checked because the package divent is not attached.
#> → Add `CheckArguments=FALSE` to suppress this warning or run `library('divent')`.
#> ! Function arguments cannot be checked because the package divent is not attached.
#> → Add `CheckArguments=FALSE` to suppress this warning or run `library('divent')`.
#> ! Function arguments cannot be checked because the package divent is not attached.
#> → Add `CheckArguments=FALSE` to suppress this warning or run `library('divent')`.
#> ! Function arguments cannot be checked because the package divent is not attached.
#> → Add `CheckArguments=FALSE` to suppress this warning or run `library('divent')`.
#> ! Function arguments cannot be checked because the package divent is not attached.
#> → Add `CheckArguments=FALSE` to suppress this warning or run `library('divent')`.
#> ! Function arguments cannot be checked because the package divent is not attached.
#> → Add `CheckArguments=FALSE` to suppress this warning or run `library('divent')`.
#> ! Function arguments cannot be checked because the package divent is not attached.
#> → Add `CheckArguments=FALSE` to suppress this warning or run `library('divent')`.
#> ! Function arguments cannot be checked because the package divent is not attached.
#> → Add `CheckArguments=FALSE` to suppress this warning or run `library('divent')`.
#> ! Function arguments cannot be checked because the package divent is not attached.
#> → Add `CheckArguments=FALSE` to suppress this warning or run `library('divent')`.
#> ! Function arguments cannot be checked because the package divent is not attached.
#> → Add `CheckArguments=FALSE` to suppress this warning or run `library('divent')`.
#> ! Function arguments cannot be checked because the package divent is not attached.
#> → Add `CheckArguments=FALSE` to suppress this warning or run `library('divent')`.
#> ! Function arguments cannot be checked because the package divent is not attached.
#> → Add `CheckArguments=FALSE` to suppress this warning or run `library('divent')`.
#> ! Function arguments cannot be checked because the package divent is not attached.
#> → Add `CheckArguments=FALSE` to suppress this warning or run `library('divent')`.
#> ! Function arguments cannot be checked because the package divent is not attached.
#> → Add `CheckArguments=FALSE` to suppress this warning or run `library('divent')`.
#> ! Function arguments cannot be checked because the package divent is not attached.
#> → Add `CheckArguments=FALSE` to suppress this warning or run `library('divent')`.
#> ! Function arguments cannot be checked because the package divent is not attached.
#> → Add `CheckArguments=FALSE` to suppress this warning or run `library('divent')`.
#> ! Function arguments cannot be checked because the package divent is not attached.
#> → Add `CheckArguments=FALSE` to suppress this warning or run `library('divent')`.
#> ! Function arguments cannot be checked because the package divent is not attached.
#> → Add `CheckArguments=FALSE` to suppress this warning or run `library('divent')`.
#> ! Function arguments cannot be checked because the package divent is not attached.
#> → Add `CheckArguments=FALSE` to suppress this warning or run `library('divent')`.
#> ! Function arguments cannot be checked because the package divent is not attached.
#> → Add `CheckArguments=FALSE` to suppress this warning or run `library('divent')`.
#> ! Function arguments cannot be checked because the package divent is not attached.
#> → Add `CheckArguments=FALSE` to suppress this warning or run `library('divent')`.
#> ! Function arguments cannot be checked because the package divent is not attached.
#> → Add `CheckArguments=FALSE` to suppress this warning or run `library('divent')`.
#> ! Function arguments cannot be checked because the package divent is not attached.
#> → Add `CheckArguments=FALSE` to suppress this warning or run `library('divent')`.
#> ! Function arguments cannot be checked because the package divent is not attached.
#> → Add `CheckArguments=FALSE` to suppress this warning or run `library('divent')`.
#> ! Function arguments cannot be checked because the package divent is not attached.
#> → Add `CheckArguments=FALSE` to suppress this warning or run `library('divent')`.
#> ! Function arguments cannot be checked because the package divent is not attached.
#> → Add `CheckArguments=FALSE` to suppress this warning or run `library('divent')`.
#> ! Function arguments cannot be checked because the package divent is not attached.
#> → Add `CheckArguments=FALSE` to suppress this warning or run `library('divent')`.
#> ! Function arguments cannot be checked because the package divent is not attached.
#> → Add `CheckArguments=FALSE` to suppress this warning or run `library('divent')`.
#> ! Function arguments cannot be checked because the package divent is not attached.
#> → Add `CheckArguments=FALSE` to suppress this warning or run `library('divent')`.
#> ! Function arguments cannot be checked because the package divent is not attached.
#> → Add `CheckArguments=FALSE` to suppress this warning or run `library('divent')`.
#> ! Function arguments cannot be checked because the package divent is not attached.
#> → Add `CheckArguments=FALSE` to suppress this warning or run `library('divent')`.
#> ! Function arguments cannot be checked because the package divent is not attached.
#> → Add `CheckArguments=FALSE` to suppress this warning or run `library('divent')`.
#> ! Function arguments cannot be checked because the package divent is not attached.
#> → Add `CheckArguments=FALSE` to suppress this warning or run `library('divent')`.
#> ! Function arguments cannot be checked because the package divent is not attached.
#> → Add `CheckArguments=FALSE` to suppress this warning or run `library('divent')`.
#> ! Function arguments cannot be checked because the package divent is not attached.
#> → Add `CheckArguments=FALSE` to suppress this warning or run `library('divent')`.
#> ! Function arguments cannot be checked because the package divent is not attached.
#> → Add `CheckArguments=FALSE` to suppress this warning or run `library('divent')`.
#> ! Function arguments cannot be checked because the package divent is not attached.
#> → Add `CheckArguments=FALSE` to suppress this warning or run `library('divent')`.
#> ! Function arguments cannot be checked because the package divent is not attached.
#> → Add `CheckArguments=FALSE` to suppress this warning or run `library('divent')`.
#> ! Function arguments cannot be checked because the package divent is not attached.
#> → Add `CheckArguments=FALSE` to suppress this warning or run `library('divent')`.
#> ! Function arguments cannot be checked because the package divent is not attached.
#> → Add `CheckArguments=FALSE` to suppress this warning or run `library('divent')`.
#> ! Function arguments cannot be checked because the package divent is not attached.
#> → Add `CheckArguments=FALSE` to suppress this warning or run `library('divent')`.
#> ! Function arguments cannot be checked because the package divent is not attached.
#> → Add `CheckArguments=FALSE` to suppress this warning or run `library('divent')`.
#> ! Function arguments cannot be checked because the package divent is not attached.
#> → Add `CheckArguments=FALSE` to suppress this warning or run `library('divent')`.
#> ! Function arguments cannot be checked because the package divent is not attached.
#> → Add `CheckArguments=FALSE` to suppress this warning or run `library('divent')`.
#> ! Function arguments cannot be checked because the package divent is not attached.
#> → Add `CheckArguments=FALSE` to suppress this warning or run `library('divent')`.
#> ! Function arguments cannot be checked because the package divent is not attached.
#> → Add `CheckArguments=FALSE` to suppress this warning or run `library('divent')`.
#> ! Function arguments cannot be checked because the package divent is not attached.
#> → Add `CheckArguments=FALSE` to suppress this warning or run `library('divent')`.
#> ! Function arguments cannot be checked because the package divent is not attached.
#> → Add `CheckArguments=FALSE` to suppress this warning or run `library('divent')`.
#> ! Function arguments cannot be checked because the package divent is not attached.
#> → Add `CheckArguments=FALSE` to suppress this warning or run `library('divent')`.
#> ! Function arguments cannot be checked because the package divent is not attached.
#> → Add `CheckArguments=FALSE` to suppress this warning or run `library('divent')`.
#> ! Function arguments cannot be checked because the package divent is not attached.
#> → Add `CheckArguments=FALSE` to suppress this warning or run `library('divent')`.
#> ! Function arguments cannot be checked because the package divent is not attached.
#> → Add `CheckArguments=FALSE` to suppress this warning or run `library('divent')`.
#> ! Function arguments cannot be checked because the package divent is not attached.
#> → Add `CheckArguments=FALSE` to suppress this warning or run `library('divent')`.
#> ! Function arguments cannot be checked because the package divent is not attached.
#> → Add `CheckArguments=FALSE` to suppress this warning or run `library('divent')`.
#> ! Function arguments cannot be checked because the package divent is not attached.
#> → Add `CheckArguments=FALSE` to suppress this warning or run `library('divent')`.
#> ! Function arguments cannot be checked because the package divent is not attached.
#> → Add `CheckArguments=FALSE` to suppress this warning or run `library('divent')`.
#> ! Function arguments cannot be checked because the package divent is not attached.
#> → Add `CheckArguments=FALSE` to suppress this warning or run `library('divent')`.
#> ! Function arguments cannot be checked because the package divent is not attached.
#> → Add `CheckArguments=FALSE` to suppress this warning or run `library('divent')`.
#> ! Function arguments cannot be checked because the package divent is not attached.
#> → Add `CheckArguments=FALSE` to suppress this warning or run `library('divent')`.
#> ! Function arguments cannot be checked because the package divent is not attached.
#> → Add `CheckArguments=FALSE` to suppress this warning or run `library('divent')`.
#> ! Function arguments cannot be checked because the package divent is not attached.
#> → Add `CheckArguments=FALSE` to suppress this warning or run `library('divent')`.
#> ! Function arguments cannot be checked because the package divent is not attached.
#> → Add `CheckArguments=FALSE` to suppress this warning or run `library('divent')`.
#> ! Function arguments cannot be checked because the package divent is not attached.
#> → Add `CheckArguments=FALSE` to suppress this warning or run `library('divent')`.
#> ! Function arguments cannot be checked because the package divent is not attached.
#> → Add `CheckArguments=FALSE` to suppress this warning or run `library('divent')`.
#> ! Function arguments cannot be checked because the package divent is not attached.
#> → Add `CheckArguments=FALSE` to suppress this warning or run `library('divent')`.
#> ! Function arguments cannot be checked because the package divent is not attached.
#> → Add `CheckArguments=FALSE` to suppress this warning or run `library('divent')`.
#> ! Function arguments cannot be checked because the package divent is not attached.
#> → Add `CheckArguments=FALSE` to suppress this warning or run `library('divent')`.
#> ! Function arguments cannot be checked because the package divent is not attached.
#> → Add `CheckArguments=FALSE` to suppress this warning or run `library('divent')`.
#> ! Function arguments cannot be checked because the package divent is not attached.
#> → Add `CheckArguments=FALSE` to suppress this warning or run `library('divent')`.
#> ! Function arguments cannot be checked because the package divent is not attached.
#> → Add `CheckArguments=FALSE` to suppress this warning or run `library('divent')`.
#> ! Function arguments cannot be checked because the package divent is not attached.
#> → Add `CheckArguments=FALSE` to suppress this warning or run `library('divent')`.
#> ! Function arguments cannot be checked because the package divent is not attached.
#> → Add `CheckArguments=FALSE` to suppress this warning or run `library('divent')`.
#> ! Function arguments cannot be checked because the package divent is not attached.
#> → Add `CheckArguments=FALSE` to suppress this warning or run `library('divent')`.
#> ! Function arguments cannot be checked because the package divent is not attached.
#> → Add `CheckArguments=FALSE` to suppress this warning or run `library('divent')`.
#> ! Function arguments cannot be checked because the package divent is not attached.
#> → Add `CheckArguments=FALSE` to suppress this warning or run `library('divent')`.
#> ! Function arguments cannot be checked because the package divent is not attached.
#> → Add `CheckArguments=FALSE` to suppress this warning or run `library('divent')`.
#> ! Function arguments cannot be checked because the package divent is not attached.
#> → Add `CheckArguments=FALSE` to suppress this warning or run `library('divent')`.
#> ! Function arguments cannot be checked because the package divent is not attached.
#> → Add `CheckArguments=FALSE` to suppress this warning or run `library('divent')`.
#> ! Function arguments cannot be checked because the package divent is not attached.
#> → Add `CheckArguments=FALSE` to suppress this warning or run `library('divent')`.
#> ! Function arguments cannot be checked because the package divent is not attached.
#> → Add `CheckArguments=FALSE` to suppress this warning or run `library('divent')`.
#> ! Function arguments cannot be checked because the package divent is not attached.
#> → Add `CheckArguments=FALSE` to suppress this warning or run `library('divent')`.
#> ! Function arguments cannot be checked because the package divent is not attached.
#> → Add `CheckArguments=FALSE` to suppress this warning or run `library('divent')`.
#> ! Function arguments cannot be checked because the package divent is not attached.
#> → Add `CheckArguments=FALSE` to suppress this warning or run `library('divent')`.
#> ! Function arguments cannot be checked because the package divent is not attached.
#> → Add `CheckArguments=FALSE` to suppress this warning or run `library('divent')`.
#> ! Function arguments cannot be checked because the package divent is not attached.
#> → Add `CheckArguments=FALSE` to suppress this warning or run `library('divent')`.
#> ! Function arguments cannot be checked because the package divent is not attached.
#> → Add `CheckArguments=FALSE` to suppress this warning or run `library('divent')`.
#> ! Function arguments cannot be checked because the package divent is not attached.
#> → Add `CheckArguments=FALSE` to suppress this warning or run `library('divent')`.
#> ! Function arguments cannot be checked because the package divent is not attached.
#> → Add `CheckArguments=FALSE` to suppress this warning or run `library('divent')`.
#> ! Function arguments cannot be checked because the package divent is not attached.
#> → Add `CheckArguments=FALSE` to suppress this warning or run `library('divent')`.
#> ! Function arguments cannot be checked because the package divent is not attached.
#> → Add `CheckArguments=FALSE` to suppress this warning or run `library('divent')`.
#> ! Function arguments cannot be checked because the package divent is not attached.
#> → Add `CheckArguments=FALSE` to suppress this warning or run `library('divent')`.
#> ! Function arguments cannot be checked because the package divent is not attached.
#> → Add `CheckArguments=FALSE` to suppress this warning or run `library('divent')`.
#> ! Function arguments cannot be checked because the package divent is not attached.
#> → Add `CheckArguments=FALSE` to suppress this warning or run `library('divent')`.
#> ! Function arguments cannot be checked because the package divent is not attached.
#> → Add `CheckArguments=FALSE` to suppress this warning or run `library('divent')`.
#> ! Function arguments cannot be checked because the package divent is not attached.
#> → Add `CheckArguments=FALSE` to suppress this warning or run `library('divent')`.
#> ! Function arguments cannot be checked because the package divent is not attached.
#> → Add `CheckArguments=FALSE` to suppress this warning or run `library('divent')`.
#> ! Function arguments cannot be checked because the package divent is not attached.
#> → Add `CheckArguments=FALSE` to suppress this warning or run `library('divent')`.
#> ! Function arguments cannot be checked because the package divent is not attached.
#> → Add `CheckArguments=FALSE` to suppress this warning or run `library('divent')`.
#> ! Function arguments cannot be checked because the package divent is not attached.
#> → Add `CheckArguments=FALSE` to suppress this warning or run `library('divent')`.
#> ! Function arguments cannot be checked because the package divent is not attached.
#> → Add `CheckArguments=FALSE` to suppress this warning or run `library('divent')`.
#> ! Function arguments cannot be checked because the package divent is not attached.
#> → Add `CheckArguments=FALSE` to suppress this warning or run `library('divent')`.
#> ! Function arguments cannot be checked because the package divent is not attached.
#> → Add `CheckArguments=FALSE` to suppress this warning or run `library('divent')`.
#> ! Function arguments cannot be checked because the package divent is not attached.
#> → Add `CheckArguments=FALSE` to suppress this warning or run `library('divent')`.
#> ! Function arguments cannot be checked because the package divent is not attached.
#> → Add `CheckArguments=FALSE` to suppress this warning or run `library('divent')`.
#> ! Function arguments cannot be checked because the package divent is not attached.
#> → Add `CheckArguments=FALSE` to suppress this warning or run `library('divent')`.
#> ! Function arguments cannot be checked because the package divent is not attached.
#> → Add `CheckArguments=FALSE` to suppress this warning or run `library('divent')`.
#> ! Function arguments cannot be checked because the package divent is not attached.
#> → Add `CheckArguments=FALSE` to suppress this warning or run `library('divent')`.
#> ! Function arguments cannot be checked because the package divent is not attached.
#> → Add `CheckArguments=FALSE` to suppress this warning or run `library('divent')`.
#> ! Function arguments cannot be checked because the package divent is not attached.
#> → Add `CheckArguments=FALSE` to suppress this warning or run `library('divent')`.
#> ! Function arguments cannot be checked because the package divent is not attached.
#> → Add `CheckArguments=FALSE` to suppress this warning or run `library('divent')`.
#> ! Function arguments cannot be checked because the package divent is not attached.
#> → Add `CheckArguments=FALSE` to suppress this warning or run `library('divent')`.
#> ! Function arguments cannot be checked because the package divent is not attached.
#> → Add `CheckArguments=FALSE` to suppress this warning or run `library('divent')`.
#> ! Function arguments cannot be checked because the package divent is not attached.
#> → Add `CheckArguments=FALSE` to suppress this warning or run `library('divent')`.
#> ! Function arguments cannot be checked because the package divent is not attached.
#> → Add `CheckArguments=FALSE` to suppress this warning or run `library('divent')`.
#> ! Function arguments cannot be checked because the package divent is not attached.
#> → Add `CheckArguments=FALSE` to suppress this warning or run `library('divent')`.
#> ! Function arguments cannot be checked because the package divent is not attached.
#> → Add `CheckArguments=FALSE` to suppress this warning or run `library('divent')`.
#> ! Function arguments cannot be checked because the package divent is not attached.
#> → Add `CheckArguments=FALSE` to suppress this warning or run `library('divent')`.
#> ! Function arguments cannot be checked because the package divent is not attached.
#> → Add `CheckArguments=FALSE` to suppress this warning or run `library('divent')`.
#> ! Function arguments cannot be checked because the package divent is not attached.
#> → Add `CheckArguments=FALSE` to suppress this warning or run `library('divent')`.
#> ! Function arguments cannot be checked because the package divent is not attached.
#> → Add `CheckArguments=FALSE` to suppress this warning or run `library('divent')`.
#> ! Function arguments cannot be checked because the package divent is not attached.
#> → Add `CheckArguments=FALSE` to suppress this warning or run `library('divent')`.
#> ! Function arguments cannot be checked because the package divent is not attached.
#> → Add `CheckArguments=FALSE` to suppress this warning or run `library('divent')`.
#> ! Function arguments cannot be checked because the package divent is not attached.
#> → Add `CheckArguments=FALSE` to suppress this warning or run `library('divent')`.
#> ! Function arguments cannot be checked because the package divent is not attached.
#> → Add `CheckArguments=FALSE` to suppress this warning or run `library('divent')`.
#> ! Function arguments cannot be checked because the package divent is not attached.
#> → Add `CheckArguments=FALSE` to suppress this warning or run `library('divent')`.
#> ! Function arguments cannot be checked because the package divent is not attached.
#> → Add `CheckArguments=FALSE` to suppress this warning or run `library('divent')`.
#> ! Function arguments cannot be checked because the package divent is not attached.
#> → Add `CheckArguments=FALSE` to suppress this warning or run `library('divent')`.
#> ! Function arguments cannot be checked because the package divent is not attached.
#> → Add `CheckArguments=FALSE` to suppress this warning or run `library('divent')`.
#> ! Function arguments cannot be checked because the package divent is not attached.
#> → Add `CheckArguments=FALSE` to suppress this warning or run `library('divent')`.
#> ! Function arguments cannot be checked because the package divent is not attached.
#> → Add `CheckArguments=FALSE` to suppress this warning or run `library('divent')`.
#> ! Function arguments cannot be checked because the package divent is not attached.
#> → Add `CheckArguments=FALSE` to suppress this warning or run `library('divent')`.
#> ! Function arguments cannot be checked because the package divent is not attached.
#> → Add `CheckArguments=FALSE` to suppress this warning or run `library('divent')`.
#> ! Function arguments cannot be checked because the package divent is not attached.
#> → Add `CheckArguments=FALSE` to suppress this warning or run `library('divent')`.
#> ! Function arguments cannot be checked because the package divent is not attached.
#> → Add `CheckArguments=FALSE` to suppress this warning or run `library('divent')`.
#> ! Function arguments cannot be checked because the package divent is not attached.
#> → Add `CheckArguments=FALSE` to suppress this warning or run `library('divent')`.
#> ! Function arguments cannot be checked because the package divent is not attached.
#> → Add `CheckArguments=FALSE` to suppress this warning or run `library('divent')`.
#> ! Function arguments cannot be checked because the package divent is not attached.
#> → Add `CheckArguments=FALSE` to suppress this warning or run `library('divent')`.
#> ! Function arguments cannot be checked because the package divent is not attached.
#> → Add `CheckArguments=FALSE` to suppress this warning or run `library('divent')`.
#> ! Function arguments cannot be checked because the package divent is not attached.
#> → Add `CheckArguments=FALSE` to suppress this warning or run `library('divent')`.
#> ! Function arguments cannot be checked because the package divent is not attached.
#> → Add `CheckArguments=FALSE` to suppress this warning or run `library('divent')`.
#> ! Function arguments cannot be checked because the package divent is not attached.
#> → Add `CheckArguments=FALSE` to suppress this warning or run `library('divent')`.
#> ! Function arguments cannot be checked because the package divent is not attached.
#> → Add `CheckArguments=FALSE` to suppress this warning or run `library('divent')`.
#> ! Function arguments cannot be checked because the package divent is not attached.
#> → Add `CheckArguments=FALSE` to suppress this warning or run `library('divent')`.
#> ! Function arguments cannot be checked because the package divent is not attached.
#> → Add `CheckArguments=FALSE` to suppress this warning or run `library('divent')`.
#> ! Function arguments cannot be checked because the package divent is not attached.
#> → Add `CheckArguments=FALSE` to suppress this warning or run `library('divent')`.
#> ! Function arguments cannot be checked because the package divent is not attached.
#> → Add `CheckArguments=FALSE` to suppress this warning or run `library('divent')`.
#> ! Function arguments cannot be checked because the package divent is not attached.
#> → Add `CheckArguments=FALSE` to suppress this warning or run `library('divent')`.
#> ! Function arguments cannot be checked because the package divent is not attached.
#> → Add `CheckArguments=FALSE` to suppress this warning or run `library('divent')`.
#> ! Function arguments cannot be checked because the package divent is not attached.
#> → Add `CheckArguments=FALSE` to suppress this warning or run `library('divent')`.
#> ! Function arguments cannot be checked because the package divent is not attached.
#> → Add `CheckArguments=FALSE` to suppress this warning or run `library('divent')`.
#> ! Function arguments cannot be checked because the package divent is not attached.
#> → Add `CheckArguments=FALSE` to suppress this warning or run `library('divent')`.
#> ! Function arguments cannot be checked because the package divent is not attached.
#> → Add `CheckArguments=FALSE` to suppress this warning or run `library('divent')`.
#> ! Function arguments cannot be checked because the package divent is not attached.
#> → Add `CheckArguments=FALSE` to suppress this warning or run `library('divent')`.
#> ! Function arguments cannot be checked because the package divent is not attached.
#> → Add `CheckArguments=FALSE` to suppress this warning or run `library('divent')`.
#> ! Function arguments cannot be checked because the package divent is not attached.
#> → Add `CheckArguments=FALSE` to suppress this warning or run `library('divent')`.
#> ! Function arguments cannot be checked because the package divent is not attached.
#> → Add `CheckArguments=FALSE` to suppress this warning or run `library('divent')`.
#> ! Function arguments cannot be checked because the package divent is not attached.
#> → Add `CheckArguments=FALSE` to suppress this warning or run `library('divent')`.
#> ! Function arguments cannot be checked because the package divent is not attached.
#> → Add `CheckArguments=FALSE` to suppress this warning or run `library('divent')`.
#> ! Function arguments cannot be checked because the package divent is not attached.
#> → Add `CheckArguments=FALSE` to suppress this warning or run `library('divent')`.
#> ! Function arguments cannot be checked because the package divent is not attached.
#> → Add `CheckArguments=FALSE` to suppress this warning or run `library('divent')`.
#> ! Function arguments cannot be checked because the package divent is not attached.
#> → Add `CheckArguments=FALSE` to suppress this warning or run `library('divent')`.
#> ! Function arguments cannot be checked because the package divent is not attached.
#> → Add `CheckArguments=FALSE` to suppress this warning or run `library('divent')`.
#> ! Function arguments cannot be checked because the package divent is not attached.
#> → Add `CheckArguments=FALSE` to suppress this warning or run `library('divent')`.
#> ! Function arguments cannot be checked because the package divent is not attached.
#> → Add `CheckArguments=FALSE` to suppress this warning or run `library('divent')`.
#> ! Function arguments cannot be checked because the package divent is not attached.
#> → Add `CheckArguments=FALSE` to suppress this warning or run `library('divent')`.
#> ! Function arguments cannot be checked because the package divent is not attached.
#> → Add `CheckArguments=FALSE` to suppress this warning or run `library('divent')`.
#> ! Function arguments cannot be checked because the package divent is not attached.
#> → Add `CheckArguments=FALSE` to suppress this warning or run `library('divent')`.
#> ! Function arguments cannot be checked because the package divent is not attached.
#> → Add `CheckArguments=FALSE` to suppress this warning or run `library('divent')`.
#> ! Function arguments cannot be checked because the package divent is not attached.
#> → Add `CheckArguments=FALSE` to suppress this warning or run `library('divent')`.
#> ! Function arguments cannot be checked because the package divent is not attached.
#> → Add `CheckArguments=FALSE` to suppress this warning or run `library('divent')`.
#> ! Function arguments cannot be checked because the package divent is not attached.
#> → Add `CheckArguments=FALSE` to suppress this warning or run `library('divent')`.
#> ! Function arguments cannot be checked because the package divent is not attached.
#> → Add `CheckArguments=FALSE` to suppress this warning or run `library('divent')`.
#> ! Function arguments cannot be checked because the package divent is not attached.
#> → Add `CheckArguments=FALSE` to suppress this warning or run `library('divent')`.
#> ! Function arguments cannot be checked because the package divent is not attached.
#> → Add `CheckArguments=FALSE` to suppress this warning or run `library('divent')`.
#> ! Function arguments cannot be checked because the package divent is not attached.
#> → Add `CheckArguments=FALSE` to suppress this warning or run `library('divent')`.
#> ! Function arguments cannot be checked because the package divent is not attached.
#> → Add `CheckArguments=FALSE` to suppress this warning or run `library('divent')`.
#> ! Function arguments cannot be checked because the package divent is not attached.
#> → Add `CheckArguments=FALSE` to suppress this warning or run `library('divent')`.
#> ! Function arguments cannot be checked because the package divent is not attached.
#> → Add `CheckArguments=FALSE` to suppress this warning or run `library('divent')`.
#> ! Function arguments cannot be checked because the package divent is not attached.
#> → Add `CheckArguments=FALSE` to suppress this warning or run `library('divent')`.
#> ! Function arguments cannot be checked because the package divent is not attached.
#> → Add `CheckArguments=FALSE` to suppress this warning or run `library('divent')`.
#> ! Function arguments cannot be checked because the package divent is not attached.
#> → Add `CheckArguments=FALSE` to suppress this warning or run `library('divent')`.
#> ! Function arguments cannot be checked because the package divent is not attached.
#> → Add `CheckArguments=FALSE` to suppress this warning or run `library('divent')`.
#> ! Function arguments cannot be checked because the package divent is not attached.
#> → Add `CheckArguments=FALSE` to suppress this warning or run `library('divent')`.
#> ! Function arguments cannot be checked because the package divent is not attached.
#> → Add `CheckArguments=FALSE` to suppress this warning or run `library('divent')`.
#> ! Function arguments cannot be checked because the package divent is not attached.
#> → Add `CheckArguments=FALSE` to suppress this warning or run `library('divent')`.
#> ! Function arguments cannot be checked because the package divent is not attached.
#> → Add `CheckArguments=FALSE` to suppress this warning or run `library('divent')`.
#> ! Function arguments cannot be checked because the package divent is not attached.
#> → Add `CheckArguments=FALSE` to suppress this warning or run `library('divent')`.
#> ! Function arguments cannot be checked because the package divent is not attached.
#> → Add `CheckArguments=FALSE` to suppress this warning or run `library('divent')`.
#> ! Function arguments cannot be checked because the package divent is not attached.
#> → Add `CheckArguments=FALSE` to suppress this warning or run `library('divent')`.
#> ! Function arguments cannot be checked because the package divent is not attached.
#> → Add `CheckArguments=FALSE` to suppress this warning or run `library('divent')`.
#> ! Function arguments cannot be checked because the package divent is not attached.
#> → Add `CheckArguments=FALSE` to suppress this warning or run `library('divent')`.
#> ! Function arguments cannot be checked because the package divent is not attached.
#> → Add `CheckArguments=FALSE` to suppress this warning or run `library('divent')`.
#> ! Function arguments cannot be checked because the package divent is not attached.
#> → Add `CheckArguments=FALSE` to suppress this warning or run `library('divent')`.
#> ! Function arguments cannot be checked because the package divent is not attached.
#> → Add `CheckArguments=FALSE` to suppress this warning or run `library('divent')`.
#> ! Function arguments cannot be checked because the package divent is not attached.
#> → Add `CheckArguments=FALSE` to suppress this warning or run `library('divent')`.
#> ! Function arguments cannot be checked because the package divent is not attached.
#> → Add `CheckArguments=FALSE` to suppress this warning or run `library('divent')`.
#> ! Function arguments cannot be checked because the package divent is not attached.
#> → Add `CheckArguments=FALSE` to suppress this warning or run `library('divent')`.
#> ! Function arguments cannot be checked because the package divent is not attached.
#> → Add `CheckArguments=FALSE` to suppress this warning or run `library('divent')`.
#> ! Function arguments cannot be checked because the package divent is not attached.
#> → Add `CheckArguments=FALSE` to suppress this warning or run `library('divent')`.
#> ! Function arguments cannot be checked because the package divent is not attached.
#> → Add `CheckArguments=FALSE` to suppress this warning or run `library('divent')`.
#> ! Function arguments cannot be checked because the package divent is not attached.
#> → Add `CheckArguments=FALSE` to suppress this warning or run `library('divent')`.
#> ! Function arguments cannot be checked because the package divent is not attached.
#> → Add `CheckArguments=FALSE` to suppress this warning or run `library('divent')`.
#> ! Function arguments cannot be checked because the package divent is not attached.
#> → Add `CheckArguments=FALSE` to suppress this warning or run `library('divent')`.
#> ! Function arguments cannot be checked because the package divent is not attached.
#> → Add `CheckArguments=FALSE` to suppress this warning or run `library('divent')`.
#> ! Function arguments cannot be checked because the package divent is not attached.
#> → Add `CheckArguments=FALSE` to suppress this warning or run `library('divent')`.
#> ! Function arguments cannot be checked because the package divent is not attached.
#> → Add `CheckArguments=FALSE` to suppress this warning or run `library('divent')`.
#> ! Function arguments cannot be checked because the package divent is not attached.
#> → Add `CheckArguments=FALSE` to suppress this warning or run `library('divent')`.
#> ! Function arguments cannot be checked because the package divent is not attached.
#> → Add `CheckArguments=FALSE` to suppress this warning or run `library('divent')`.
#> ! Function arguments cannot be checked because the package divent is not attached.
#> → Add `CheckArguments=FALSE` to suppress this warning or run `library('divent')`.
#> ! Function arguments cannot be checked because the package divent is not attached.
#> → Add `CheckArguments=FALSE` to suppress this warning or run `library('divent')`.
#> ! Function arguments cannot be checked because the package divent is not attached.
#> → Add `CheckArguments=FALSE` to suppress this warning or run `library('divent')`.
#> ! Function arguments cannot be checked because the package divent is not attached.
#> → Add `CheckArguments=FALSE` to suppress this warning or run `library('divent')`.
#> ! Function arguments cannot be checked because the package divent is not attached.
#> → Add `CheckArguments=FALSE` to suppress this warning or run `library('divent')`.
#> ! Function arguments cannot be checked because the package divent is not attached.
#> → Add `CheckArguments=FALSE` to suppress this warning or run `library('divent')`.
#> ! Function arguments cannot be checked because the package divent is not attached.
#> → Add `CheckArguments=FALSE` to suppress this warning or run `library('divent')`.
#> ! Function arguments cannot be checked because the package divent is not attached.
#> → Add `CheckArguments=FALSE` to suppress this warning or run `library('divent')`.
#> ! Function arguments cannot be checked because the package divent is not attached.
#> → Add `CheckArguments=FALSE` to suppress this warning or run `library('divent')`.
#> ! Function arguments cannot be checked because the package divent is not attached.
#> → Add `CheckArguments=FALSE` to suppress this warning or run `library('divent')`.
#> ! Function arguments cannot be checked because the package divent is not attached.
#> → Add `CheckArguments=FALSE` to suppress this warning or run `library('divent')`.
#> ! Function arguments cannot be checked because the package divent is not attached.
#> → Add `CheckArguments=FALSE` to suppress this warning or run `library('divent')`.
#> ! Function arguments cannot be checked because the package divent is not attached.
#> → Add `CheckArguments=FALSE` to suppress this warning or run `library('divent')`.
#> ! Function arguments cannot be checked because the package divent is not attached.
#> → Add `CheckArguments=FALSE` to suppress this warning or run `library('divent')`.
#> ! Function arguments cannot be checked because the package divent is not attached.
#> → Add `CheckArguments=FALSE` to suppress this warning or run `library('divent')`.
#> ! Function arguments cannot be checked because the package divent is not attached.
#> → Add `CheckArguments=FALSE` to suppress this warning or run `library('divent')`.
#> ! Function arguments cannot be checked because the package divent is not attached.
#> → Add `CheckArguments=FALSE` to suppress this warning or run `library('divent')`.
#> ! Function arguments cannot be checked because the package divent is not attached.
#> → Add `CheckArguments=FALSE` to suppress this warning or run `library('divent')`.
#> ! Function arguments cannot be checked because the package divent is not attached.
#> → Add `CheckArguments=FALSE` to suppress this warning or run `library('divent')`.
#> ! Function arguments cannot be checked because the package divent is not attached.
#> → Add `CheckArguments=FALSE` to suppress this warning or run `library('divent')`.
#> ! Function arguments cannot be checked because the package divent is not attached.
#> → Add `CheckArguments=FALSE` to suppress this warning or run `library('divent')`.
#> ! Function arguments cannot be checked because the package divent is not attached.
#> → Add `CheckArguments=FALSE` to suppress this warning or run `library('divent')`.
#> ! Function arguments cannot be checked because the package divent is not attached.
#> → Add `CheckArguments=FALSE` to suppress this warning or run `library('divent')`.
#> ! Function arguments cannot be checked because the package divent is not attached.
#> → Add `CheckArguments=FALSE` to suppress this warning or run `library('divent')`.
#> ! Function arguments cannot be checked because the package divent is not attached.
#> → Add `CheckArguments=FALSE` to suppress this warning or run `library('divent')`.
#> ! Function arguments cannot be checked because the package divent is not attached.
#> → Add `CheckArguments=FALSE` to suppress this warning or run `library('divent')`.
#> ! Function arguments cannot be checked because the package divent is not attached.
#> → Add `CheckArguments=FALSE` to suppress this warning or run `library('divent')`.
#> ! Function arguments cannot be checked because the package divent is not attached.
#> → Add `CheckArguments=FALSE` to suppress this warning or run `library('divent')`.
#> ! Function arguments cannot be checked because the package divent is not attached.
#> → Add `CheckArguments=FALSE` to suppress this warning or run `library('divent')`.
#> ! Function arguments cannot be checked because the package divent is not attached.
#> → Add `CheckArguments=FALSE` to suppress this warning or run `library('divent')`.
#> ! Function arguments cannot be checked because the package divent is not attached.
#> → Add `CheckArguments=FALSE` to suppress this warning or run `library('divent')`.
#> ! Function arguments cannot be checked because the package divent is not attached.
#> → Add `CheckArguments=FALSE` to suppress this warning or run `library('divent')`.
#> ! Function arguments cannot be checked because the package divent is not attached.
#> → Add `CheckArguments=FALSE` to suppress this warning or run `library('divent')`.
#> ! Function arguments cannot be checked because the package divent is not attached.
#> → Add `CheckArguments=FALSE` to suppress this warning or run `library('divent')`.
#> ! Function arguments cannot be checked because the package divent is not attached.
#> → Add `CheckArguments=FALSE` to suppress this warning or run `library('divent')`.
#> ! Function arguments cannot be checked because the package divent is not attached.
#> → Add `CheckArguments=FALSE` to suppress this warning or run `library('divent')`.
#> ! Function arguments cannot be checked because the package divent is not attached.
#> → Add `CheckArguments=FALSE` to suppress this warning or run `library('divent')`.
#> ! Function arguments cannot be checked because the package divent is not attached.
#> → Add `CheckArguments=FALSE` to suppress this warning or run `library('divent')`.
#> ! Function arguments cannot be checked because the package divent is not attached.
#> → Add `CheckArguments=FALSE` to suppress this warning or run `library('divent')`.
#> ! Function arguments cannot be checked because the package divent is not attached.
#> → Add `CheckArguments=FALSE` to suppress this warning or run `library('divent')`.
#> ! Function arguments cannot be checked because the package divent is not attached.
#> → Add `CheckArguments=FALSE` to suppress this warning or run `library('divent')`.
#> ! Function arguments cannot be checked because the package divent is not attached.
#> → Add `CheckArguments=FALSE` to suppress this warning or run `library('divent')`.
#> ! Function arguments cannot be checked because the package divent is not attached.
#> → Add `CheckArguments=FALSE` to suppress this warning or run `library('divent')`.
#> ! Function arguments cannot be checked because the package divent is not attached.
#> → Add `CheckArguments=FALSE` to suppress this warning or run `library('divent')`.
#> ! Function arguments cannot be checked because the package divent is not attached.
#> → Add `CheckArguments=FALSE` to suppress this warning or run `library('divent')`.
#> ! Function arguments cannot be checked because the package divent is not attached.
#> → Add `CheckArguments=FALSE` to suppress this warning or run `library('divent')`.
#> ! Function arguments cannot be checked because the package divent is not attached.
#> → Add `CheckArguments=FALSE` to suppress this warning or run `library('divent')`.
#> ! Function arguments cannot be checked because the package divent is not attached.
#> → Add `CheckArguments=FALSE` to suppress this warning or run `library('divent')`.
#> ! Function arguments cannot be checked because the package divent is not attached.
#> → Add `CheckArguments=FALSE` to suppress this warning or run `library('divent')`.
#> ! Function arguments cannot be checked because the package divent is not attached.
#> → Add `CheckArguments=FALSE` to suppress this warning or run `library('divent')`.
#> ! Function arguments cannot be checked because the package divent is not attached.
#> → Add `CheckArguments=FALSE` to suppress this warning or run `library('divent')`.
#> ! Function arguments cannot be checked because the package divent is not attached.
#> → Add `CheckArguments=FALSE` to suppress this warning or run `library('divent')`.
#> ! Function arguments cannot be checked because the package divent is not attached.
#> → Add `CheckArguments=FALSE` to suppress this warning or run `library('divent')`.
#> ! Function arguments cannot be checked because the package divent is not attached.
#> → Add `CheckArguments=FALSE` to suppress this warning or run `library('divent')`.
#> ! Function arguments cannot be checked because the package divent is not attached.
#> → Add `CheckArguments=FALSE` to suppress this warning or run `library('divent')`.
#> ! Function arguments cannot be checked because the package divent is not attached.
#> → Add `CheckArguments=FALSE` to suppress this warning or run `library('divent')`.
#> ! Function arguments cannot be checked because the package divent is not attached.
#> → Add `CheckArguments=FALSE` to suppress this warning or run `library('divent')`.
#> ! Function arguments cannot be checked because the package divent is not attached.
#> → Add `CheckArguments=FALSE` to suppress this warning or run `library('divent')`.
#> ! Function arguments cannot be checked because the package divent is not attached.
#> → Add `CheckArguments=FALSE` to suppress this warning or run `library('divent')`.
#> ! Function arguments cannot be checked because the package divent is not attached.
#> → Add `CheckArguments=FALSE` to suppress this warning or run `library('divent')`.
#> ! Function arguments cannot be checked because the package divent is not attached.
#> → Add `CheckArguments=FALSE` to suppress this warning or run `library('divent')`.
#> ! Function arguments cannot be checked because the package divent is not attached.
#> → Add `CheckArguments=FALSE` to suppress this warning or run `library('divent')`.
#> ! Function arguments cannot be checked because the package divent is not attached.
#> → Add `CheckArguments=FALSE` to suppress this warning or run `library('divent')`.
#> ! Function arguments cannot be checked because the package divent is not attached.
#> → Add `CheckArguments=FALSE` to suppress this warning or run `library('divent')`.
#> ! Function arguments cannot be checked because the package divent is not attached.
#> → Add `CheckArguments=FALSE` to suppress this warning or run `library('divent')`.
#> ! Function arguments cannot be checked because the package divent is not attached.
#> → Add `CheckArguments=FALSE` to suppress this warning or run `library('divent')`.
#> ! Function arguments cannot be checked because the package divent is not attached.
#> → Add `CheckArguments=FALSE` to suppress this warning or run `library('divent')`.
#> ! Function arguments cannot be checked because the package divent is not attached.
#> → Add `CheckArguments=FALSE` to suppress this warning or run `library('divent')`.
#> ! Function arguments cannot be checked because the package divent is not attached.
#> → Add `CheckArguments=FALSE` to suppress this warning or run `library('divent')`.
#> ! Function arguments cannot be checked because the package divent is not attached.
#> → Add `CheckArguments=FALSE` to suppress this warning or run `library('divent')`.
#> ! Function arguments cannot be checked because the package divent is not attached.
#> → Add `CheckArguments=FALSE` to suppress this warning or run `library('divent')`.
#> ! Function arguments cannot be checked because the package divent is not attached.
#> → Add `CheckArguments=FALSE` to suppress this warning or run `library('divent')`.
#> ! Function arguments cannot be checked because the package divent is not attached.
#> → Add `CheckArguments=FALSE` to suppress this warning or run `library('divent')`.
#> ! Function arguments cannot be checked because the package divent is not attached.
#> → Add `CheckArguments=FALSE` to suppress this warning or run `library('divent')`.
#> ! Function arguments cannot be checked because the package divent is not attached.
#> → Add `CheckArguments=FALSE` to suppress this warning or run `library('divent')`.
#> ! Function arguments cannot be checked because the package divent is not attached.
#> → Add `CheckArguments=FALSE` to suppress this warning or run `library('divent')`.
#> ! Function arguments cannot be checked because the package divent is not attached.
#> → Add `CheckArguments=FALSE` to suppress this warning or run `library('divent')`.
#> ! Function arguments cannot be checked because the package divent is not attached.
#> → Add `CheckArguments=FALSE` to suppress this warning or run `library('divent')`.
#> ! Function arguments cannot be checked because the package divent is not attached.
#> → Add `CheckArguments=FALSE` to suppress this warning or run `library('divent')`.
#> ! Function arguments cannot be checked because the package divent is not attached.
#> → Add `CheckArguments=FALSE` to suppress this warning or run `library('divent')`.
#> ! Function arguments cannot be checked because the package divent is not attached.
#> → Add `CheckArguments=FALSE` to suppress this warning or run `library('divent')`.
#> ! Function arguments cannot be checked because the package divent is not attached.
#> → Add `CheckArguments=FALSE` to suppress this warning or run `library('divent')`.
#> ! Function arguments cannot be checked because the package divent is not attached.
#> → Add `CheckArguments=FALSE` to suppress this warning or run `library('divent')`.
#> ! Function arguments cannot be checked because the package divent is not attached.
#> → Add `CheckArguments=FALSE` to suppress this warning or run `library('divent')`.
#> ! Function arguments cannot be checked because the package divent is not attached.
#> → Add `CheckArguments=FALSE` to suppress this warning or run `library('divent')`.
#> ! Function arguments cannot be checked because the package divent is not attached.
#> → Add `CheckArguments=FALSE` to suppress this warning or run `library('divent')`.
#> ! Function arguments cannot be checked because the package divent is not attached.
#> → Add `CheckArguments=FALSE` to suppress this warning or run `library('divent')`.
#> ! Function arguments cannot be checked because the package divent is not attached.
#> → Add `CheckArguments=FALSE` to suppress this warning or run `library('divent')`.
#> ! Function arguments cannot be checked because the package divent is not attached.
#> → Add `CheckArguments=FALSE` to suppress this warning or run `library('divent')`.
#> ! Function arguments cannot be checked because the package divent is not attached.
#> → Add `CheckArguments=FALSE` to suppress this warning or run `library('divent')`.
#> ! Function arguments cannot be checked because the package divent is not attached.
#> → Add `CheckArguments=FALSE` to suppress this warning or run `library('divent')`.
#> ! Function arguments cannot be checked because the package divent is not attached.
#> → Add `CheckArguments=FALSE` to suppress this warning or run `library('divent')`.
#> ! Function arguments cannot be checked because the package divent is not attached.
#> → Add `CheckArguments=FALSE` to suppress this warning or run `library('divent')`.
#> ! Function arguments cannot be checked because the package divent is not attached.
#> → Add `CheckArguments=FALSE` to suppress this warning or run `library('divent')`.
#> ! Function arguments cannot be checked because the package divent is not attached.
#> → Add `CheckArguments=FALSE` to suppress this warning or run `library('divent')`.
#> ! Function arguments cannot be checked because the package divent is not attached.
#> → Add `CheckArguments=FALSE` to suppress this warning or run `library('divent')`.
#> ! Function arguments cannot be checked because the package divent is not attached.
#> → Add `CheckArguments=FALSE` to suppress this warning or run `library('divent')`.
#> ! Function arguments cannot be checked because the package divent is not attached.
#> → Add `CheckArguments=FALSE` to suppress this warning or run `library('divent')`.
#> ! Function arguments cannot be checked because the package divent is not attached.
#> → Add `CheckArguments=FALSE` to suppress this warning or run `library('divent')`.
#> ! Function arguments cannot be checked because the package divent is not attached.
#> → Add `CheckArguments=FALSE` to suppress this warning or run `library('divent')`.
#> ! Function arguments cannot be checked because the package divent is not attached.
#> → Add `CheckArguments=FALSE` to suppress this warning or run `library('divent')`.
#> ! Function arguments cannot be checked because the package divent is not attached.
#> → Add `CheckArguments=FALSE` to suppress this warning or run `library('divent')`.
#> ! Function arguments cannot be checked because the package divent is not attached.
#> → Add `CheckArguments=FALSE` to suppress this warning or run `library('divent')`.
#> ! Function arguments cannot be checked because the package divent is not attached.
#> → Add `CheckArguments=FALSE` to suppress this warning or run `library('divent')`.
#> ! Function arguments cannot be checked because the package divent is not attached.
#> → Add `CheckArguments=FALSE` to suppress this warning or run `library('divent')`.
#> ! Function arguments cannot be checked because the package divent is not attached.
#> → Add `CheckArguments=FALSE` to suppress this warning or run `library('divent')`.
#> ! Function arguments cannot be checked because the package divent is not attached.
#> → Add `CheckArguments=FALSE` to suppress this warning or run `library('divent')`.
#> ! Function arguments cannot be checked because the package divent is not attached.
#> → Add `CheckArguments=FALSE` to suppress this warning or run `library('divent')`.
#> Warning: Removed 2 rows containing missing values or values outside the scale range
#> (`geom_boot_ci()`).
#> Warning: Removed 2 rows containing missing values or values outside the scale range
#> (`geom_boot_ci()`).
#> Warning: Removed 2 rows containing missing values or values outside the scale range
#> (`geom_boot_ci()`).
#> → Processing: fungi_clust
#> ! Function arguments cannot be checked because the package divent is not attached.
#> → Add `CheckArguments=FALSE` to suppress this warning or run `library('divent')`.
#> ! Function arguments cannot be checked because the package divent is not attached.
#> → Add `CheckArguments=FALSE` to suppress this warning or run `library('divent')`.
#> ! Function arguments cannot be checked because the package divent is not attached.
#> → Add `CheckArguments=FALSE` to suppress this warning or run `library('divent')`.
#> ! Function arguments cannot be checked because the package divent is not attached.
#> → Add `CheckArguments=FALSE` to suppress this warning or run `library('divent')`.
#> ! Function arguments cannot be checked because the package divent is not attached.
#> → Add `CheckArguments=FALSE` to suppress this warning or run `library('divent')`.
#> ! Function arguments cannot be checked because the package divent is not attached.
#> → Add `CheckArguments=FALSE` to suppress this warning or run `library('divent')`.
#> ! Function arguments cannot be checked because the package divent is not attached.
#> → Add `CheckArguments=FALSE` to suppress this warning or run `library('divent')`.
#> ! Function arguments cannot be checked because the package divent is not attached.
#> → Add `CheckArguments=FALSE` to suppress this warning or run `library('divent')`.
#> ! Function arguments cannot be checked because the package divent is not attached.
#> → Add `CheckArguments=FALSE` to suppress this warning or run `library('divent')`.
#> ! Function arguments cannot be checked because the package divent is not attached.
#> → Add `CheckArguments=FALSE` to suppress this warning or run `library('divent')`.
#> ! Function arguments cannot be checked because the package divent is not attached.
#> → Add `CheckArguments=FALSE` to suppress this warning or run `library('divent')`.
#> ! Function arguments cannot be checked because the package divent is not attached.
#> → Add `CheckArguments=FALSE` to suppress this warning or run `library('divent')`.
#> ! Function arguments cannot be checked because the package divent is not attached.
#> → Add `CheckArguments=FALSE` to suppress this warning or run `library('divent')`.
#> ! Function arguments cannot be checked because the package divent is not attached.
#> → Add `CheckArguments=FALSE` to suppress this warning or run `library('divent')`.
#> ! Function arguments cannot be checked because the package divent is not attached.
#> → Add `CheckArguments=FALSE` to suppress this warning or run `library('divent')`.
#> ! Function arguments cannot be checked because the package divent is not attached.
#> → Add `CheckArguments=FALSE` to suppress this warning or run `library('divent')`.
#> ! Function arguments cannot be checked because the package divent is not attached.
#> → Add `CheckArguments=FALSE` to suppress this warning or run `library('divent')`.
#> ! Function arguments cannot be checked because the package divent is not attached.
#> → Add `CheckArguments=FALSE` to suppress this warning or run `library('divent')`.
#> ! Function arguments cannot be checked because the package divent is not attached.
#> → Add `CheckArguments=FALSE` to suppress this warning or run `library('divent')`.
#> ! Function arguments cannot be checked because the package divent is not attached.
#> → Add `CheckArguments=FALSE` to suppress this warning or run `library('divent')`.
#> ! Function arguments cannot be checked because the package divent is not attached.
#> → Add `CheckArguments=FALSE` to suppress this warning or run `library('divent')`.
#> ! Function arguments cannot be checked because the package divent is not attached.
#> → Add `CheckArguments=FALSE` to suppress this warning or run `library('divent')`.
#> ! Function arguments cannot be checked because the package divent is not attached.
#> → Add `CheckArguments=FALSE` to suppress this warning or run `library('divent')`.
#> ! Function arguments cannot be checked because the package divent is not attached.
#> → Add `CheckArguments=FALSE` to suppress this warning or run `library('divent')`.
#> ! Function arguments cannot be checked because the package divent is not attached.
#> → Add `CheckArguments=FALSE` to suppress this warning or run `library('divent')`.
#> ! Function arguments cannot be checked because the package divent is not attached.
#> → Add `CheckArguments=FALSE` to suppress this warning or run `library('divent')`.
#> ! Function arguments cannot be checked because the package divent is not attached.
#> → Add `CheckArguments=FALSE` to suppress this warning or run `library('divent')`.
#> ! Function arguments cannot be checked because the package divent is not attached.
#> → Add `CheckArguments=FALSE` to suppress this warning or run `library('divent')`.
#> ! Function arguments cannot be checked because the package divent is not attached.
#> → Add `CheckArguments=FALSE` to suppress this warning or run `library('divent')`.
#> ! Function arguments cannot be checked because the package divent is not attached.
#> → Add `CheckArguments=FALSE` to suppress this warning or run `library('divent')`.
#> ! Function arguments cannot be checked because the package divent is not attached.
#> → Add `CheckArguments=FALSE` to suppress this warning or run `library('divent')`.
#> ! Function arguments cannot be checked because the package divent is not attached.
#> → Add `CheckArguments=FALSE` to suppress this warning or run `library('divent')`.
#> ! Function arguments cannot be checked because the package divent is not attached.
#> → Add `CheckArguments=FALSE` to suppress this warning or run `library('divent')`.
#> ! Function arguments cannot be checked because the package divent is not attached.
#> → Add `CheckArguments=FALSE` to suppress this warning or run `library('divent')`.
#> ! Function arguments cannot be checked because the package divent is not attached.
#> → Add `CheckArguments=FALSE` to suppress this warning or run `library('divent')`.
#> ! Function arguments cannot be checked because the package divent is not attached.
#> → Add `CheckArguments=FALSE` to suppress this warning or run `library('divent')`.
#> ! Function arguments cannot be checked because the package divent is not attached.
#> → Add `CheckArguments=FALSE` to suppress this warning or run `library('divent')`.
#> ! Function arguments cannot be checked because the package divent is not attached.
#> → Add `CheckArguments=FALSE` to suppress this warning or run `library('divent')`.
#> ! Function arguments cannot be checked because the package divent is not attached.
#> → Add `CheckArguments=FALSE` to suppress this warning or run `library('divent')`.
#> ! Function arguments cannot be checked because the package divent is not attached.
#> → Add `CheckArguments=FALSE` to suppress this warning or run `library('divent')`.
#> ! Function arguments cannot be checked because the package divent is not attached.
#> → Add `CheckArguments=FALSE` to suppress this warning or run `library('divent')`.
#> ! Function arguments cannot be checked because the package divent is not attached.
#> → Add `CheckArguments=FALSE` to suppress this warning or run `library('divent')`.
#> ! Function arguments cannot be checked because the package divent is not attached.
#> → Add `CheckArguments=FALSE` to suppress this warning or run `library('divent')`.
#> ! Function arguments cannot be checked because the package divent is not attached.
#> → Add `CheckArguments=FALSE` to suppress this warning or run `library('divent')`.
#> ! Function arguments cannot be checked because the package divent is not attached.
#> → Add `CheckArguments=FALSE` to suppress this warning or run `library('divent')`.
#> ! Function arguments cannot be checked because the package divent is not attached.
#> → Add `CheckArguments=FALSE` to suppress this warning or run `library('divent')`.
#> ! Function arguments cannot be checked because the package divent is not attached.
#> → Add `CheckArguments=FALSE` to suppress this warning or run `library('divent')`.
#> ! Function arguments cannot be checked because the package divent is not attached.
#> → Add `CheckArguments=FALSE` to suppress this warning or run `library('divent')`.
#> ! Function arguments cannot be checked because the package divent is not attached.
#> → Add `CheckArguments=FALSE` to suppress this warning or run `library('divent')`.
#> ! Function arguments cannot be checked because the package divent is not attached.
#> → Add `CheckArguments=FALSE` to suppress this warning or run `library('divent')`.
#> ! Function arguments cannot be checked because the package divent is not attached.
#> → Add `CheckArguments=FALSE` to suppress this warning or run `library('divent')`.
#> ! Function arguments cannot be checked because the package divent is not attached.
#> → Add `CheckArguments=FALSE` to suppress this warning or run `library('divent')`.
#> ! Function arguments cannot be checked because the package divent is not attached.
#> → Add `CheckArguments=FALSE` to suppress this warning or run `library('divent')`.
#> ! Function arguments cannot be checked because the package divent is not attached.
#> → Add `CheckArguments=FALSE` to suppress this warning or run `library('divent')`.
#> ! Function arguments cannot be checked because the package divent is not attached.
#> → Add `CheckArguments=FALSE` to suppress this warning or run `library('divent')`.
#> ! Function arguments cannot be checked because the package divent is not attached.
#> → Add `CheckArguments=FALSE` to suppress this warning or run `library('divent')`.
#> ! Function arguments cannot be checked because the package divent is not attached.
#> → Add `CheckArguments=FALSE` to suppress this warning or run `library('divent')`.
#> ! Function arguments cannot be checked because the package divent is not attached.
#> → Add `CheckArguments=FALSE` to suppress this warning or run `library('divent')`.
#> ! Function arguments cannot be checked because the package divent is not attached.
#> → Add `CheckArguments=FALSE` to suppress this warning or run `library('divent')`.
#> ! Function arguments cannot be checked because the package divent is not attached.
#> → Add `CheckArguments=FALSE` to suppress this warning or run `library('divent')`.
#> ! Function arguments cannot be checked because the package divent is not attached.
#> → Add `CheckArguments=FALSE` to suppress this warning or run `library('divent')`.
#> ! Function arguments cannot be checked because the package divent is not attached.
#> → Add `CheckArguments=FALSE` to suppress this warning or run `library('divent')`.
#> ! Function arguments cannot be checked because the package divent is not attached.
#> → Add `CheckArguments=FALSE` to suppress this warning or run `library('divent')`.
#> ! Function arguments cannot be checked because the package divent is not attached.
#> → Add `CheckArguments=FALSE` to suppress this warning or run `library('divent')`.
#> ! Function arguments cannot be checked because the package divent is not attached.
#> → Add `CheckArguments=FALSE` to suppress this warning or run `library('divent')`.
#> ! Function arguments cannot be checked because the package divent is not attached.
#> → Add `CheckArguments=FALSE` to suppress this warning or run `library('divent')`.
#> ! Function arguments cannot be checked because the package divent is not attached.
#> → Add `CheckArguments=FALSE` to suppress this warning or run `library('divent')`.
#> ! Function arguments cannot be checked because the package divent is not attached.
#> → Add `CheckArguments=FALSE` to suppress this warning or run `library('divent')`.
#> ! Function arguments cannot be checked because the package divent is not attached.
#> → Add `CheckArguments=FALSE` to suppress this warning or run `library('divent')`.
#> ! Function arguments cannot be checked because the package divent is not attached.
#> → Add `CheckArguments=FALSE` to suppress this warning or run `library('divent')`.
#> ! Function arguments cannot be checked because the package divent is not attached.
#> → Add `CheckArguments=FALSE` to suppress this warning or run `library('divent')`.
#> ! Function arguments cannot be checked because the package divent is not attached.
#> → Add `CheckArguments=FALSE` to suppress this warning or run `library('divent')`.
#> ! Function arguments cannot be checked because the package divent is not attached.
#> → Add `CheckArguments=FALSE` to suppress this warning or run `library('divent')`.
#> ! Function arguments cannot be checked because the package divent is not attached.
#> → Add `CheckArguments=FALSE` to suppress this warning or run `library('divent')`.
#> ! Function arguments cannot be checked because the package divent is not attached.
#> → Add `CheckArguments=FALSE` to suppress this warning or run `library('divent')`.
#> ! Function arguments cannot be checked because the package divent is not attached.
#> → Add `CheckArguments=FALSE` to suppress this warning or run `library('divent')`.
#> ! Function arguments cannot be checked because the package divent is not attached.
#> → Add `CheckArguments=FALSE` to suppress this warning or run `library('divent')`.
#> ! Function arguments cannot be checked because the package divent is not attached.
#> → Add `CheckArguments=FALSE` to suppress this warning or run `library('divent')`.
#> ! Function arguments cannot be checked because the package divent is not attached.
#> → Add `CheckArguments=FALSE` to suppress this warning or run `library('divent')`.
#> ! Function arguments cannot be checked because the package divent is not attached.
#> → Add `CheckArguments=FALSE` to suppress this warning or run `library('divent')`.
#> ! Function arguments cannot be checked because the package divent is not attached.
#> → Add `CheckArguments=FALSE` to suppress this warning or run `library('divent')`.
#> ! Function arguments cannot be checked because the package divent is not attached.
#> → Add `CheckArguments=FALSE` to suppress this warning or run `library('divent')`.
#> ! Function arguments cannot be checked because the package divent is not attached.
#> → Add `CheckArguments=FALSE` to suppress this warning or run `library('divent')`.
#> ! Function arguments cannot be checked because the package divent is not attached.
#> → Add `CheckArguments=FALSE` to suppress this warning or run `library('divent')`.
#> ! Function arguments cannot be checked because the package divent is not attached.
#> → Add `CheckArguments=FALSE` to suppress this warning or run `library('divent')`.
#> ! Function arguments cannot be checked because the package divent is not attached.
#> → Add `CheckArguments=FALSE` to suppress this warning or run `library('divent')`.
#> ! Function arguments cannot be checked because the package divent is not attached.
#> → Add `CheckArguments=FALSE` to suppress this warning or run `library('divent')`.
#> ! Function arguments cannot be checked because the package divent is not attached.
#> → Add `CheckArguments=FALSE` to suppress this warning or run `library('divent')`.
#> ! Function arguments cannot be checked because the package divent is not attached.
#> → Add `CheckArguments=FALSE` to suppress this warning or run `library('divent')`.
#> ! Function arguments cannot be checked because the package divent is not attached.
#> → Add `CheckArguments=FALSE` to suppress this warning or run `library('divent')`.
#> ! Function arguments cannot be checked because the package divent is not attached.
#> → Add `CheckArguments=FALSE` to suppress this warning or run `library('divent')`.
#> ! Function arguments cannot be checked because the package divent is not attached.
#> → Add `CheckArguments=FALSE` to suppress this warning or run `library('divent')`.
#> ! Function arguments cannot be checked because the package divent is not attached.
#> → Add `CheckArguments=FALSE` to suppress this warning or run `library('divent')`.
#> ! Function arguments cannot be checked because the package divent is not attached.
#> → Add `CheckArguments=FALSE` to suppress this warning or run `library('divent')`.
#> ! Function arguments cannot be checked because the package divent is not attached.
#> → Add `CheckArguments=FALSE` to suppress this warning or run `library('divent')`.
#> ! Function arguments cannot be checked because the package divent is not attached.
#> → Add `CheckArguments=FALSE` to suppress this warning or run `library('divent')`.
#> ! Function arguments cannot be checked because the package divent is not attached.
#> → Add `CheckArguments=FALSE` to suppress this warning or run `library('divent')`.
#> ! Function arguments cannot be checked because the package divent is not attached.
#> → Add `CheckArguments=FALSE` to suppress this warning or run `library('divent')`.
#> ! Function arguments cannot be checked because the package divent is not attached.
#> → Add `CheckArguments=FALSE` to suppress this warning or run `library('divent')`.
#> ! Function arguments cannot be checked because the package divent is not attached.
#> → Add `CheckArguments=FALSE` to suppress this warning or run `library('divent')`.
#> ! Function arguments cannot be checked because the package divent is not attached.
#> → Add `CheckArguments=FALSE` to suppress this warning or run `library('divent')`.
#> ! Function arguments cannot be checked because the package divent is not attached.
#> → Add `CheckArguments=FALSE` to suppress this warning or run `library('divent')`.
#> ! Function arguments cannot be checked because the package divent is not attached.
#> → Add `CheckArguments=FALSE` to suppress this warning or run `library('divent')`.
#> ! Function arguments cannot be checked because the package divent is not attached.
#> → Add `CheckArguments=FALSE` to suppress this warning or run `library('divent')`.
#> ! Function arguments cannot be checked because the package divent is not attached.
#> → Add `CheckArguments=FALSE` to suppress this warning or run `library('divent')`.
#> ! Function arguments cannot be checked because the package divent is not attached.
#> → Add `CheckArguments=FALSE` to suppress this warning or run `library('divent')`.
#> ! Function arguments cannot be checked because the package divent is not attached.
#> → Add `CheckArguments=FALSE` to suppress this warning or run `library('divent')`.
#> ! Function arguments cannot be checked because the package divent is not attached.
#> → Add `CheckArguments=FALSE` to suppress this warning or run `library('divent')`.
#> ! Function arguments cannot be checked because the package divent is not attached.
#> → Add `CheckArguments=FALSE` to suppress this warning or run `library('divent')`.
#> ! Function arguments cannot be checked because the package divent is not attached.
#> → Add `CheckArguments=FALSE` to suppress this warning or run `library('divent')`.
#> ! Function arguments cannot be checked because the package divent is not attached.
#> → Add `CheckArguments=FALSE` to suppress this warning or run `library('divent')`.
#> ! Function arguments cannot be checked because the package divent is not attached.
#> → Add `CheckArguments=FALSE` to suppress this warning or run `library('divent')`.
#> ! Function arguments cannot be checked because the package divent is not attached.
#> → Add `CheckArguments=FALSE` to suppress this warning or run `library('divent')`.
#> ! Function arguments cannot be checked because the package divent is not attached.
#> → Add `CheckArguments=FALSE` to suppress this warning or run `library('divent')`.
#> ! Function arguments cannot be checked because the package divent is not attached.
#> → Add `CheckArguments=FALSE` to suppress this warning or run `library('divent')`.
#> ! Function arguments cannot be checked because the package divent is not attached.
#> → Add `CheckArguments=FALSE` to suppress this warning or run `library('divent')`.
#> ! Function arguments cannot be checked because the package divent is not attached.
#> → Add `CheckArguments=FALSE` to suppress this warning or run `library('divent')`.
#> ! Function arguments cannot be checked because the package divent is not attached.
#> → Add `CheckArguments=FALSE` to suppress this warning or run `library('divent')`.
#> ! Function arguments cannot be checked because the package divent is not attached.
#> → Add `CheckArguments=FALSE` to suppress this warning or run `library('divent')`.
#> ! Function arguments cannot be checked because the package divent is not attached.
#> → Add `CheckArguments=FALSE` to suppress this warning or run `library('divent')`.
#> ! Function arguments cannot be checked because the package divent is not attached.
#> → Add `CheckArguments=FALSE` to suppress this warning or run `library('divent')`.
#> ! Function arguments cannot be checked because the package divent is not attached.
#> → Add `CheckArguments=FALSE` to suppress this warning or run `library('divent')`.
#> ! Function arguments cannot be checked because the package divent is not attached.
#> → Add `CheckArguments=FALSE` to suppress this warning or run `library('divent')`.
#> ! Function arguments cannot be checked because the package divent is not attached.
#> → Add `CheckArguments=FALSE` to suppress this warning or run `library('divent')`.
#> ! Function arguments cannot be checked because the package divent is not attached.
#> → Add `CheckArguments=FALSE` to suppress this warning or run `library('divent')`.
#> ! Function arguments cannot be checked because the package divent is not attached.
#> → Add `CheckArguments=FALSE` to suppress this warning or run `library('divent')`.
#> ! Function arguments cannot be checked because the package divent is not attached.
#> → Add `CheckArguments=FALSE` to suppress this warning or run `library('divent')`.
#> ! Function arguments cannot be checked because the package divent is not attached.
#> → Add `CheckArguments=FALSE` to suppress this warning or run `library('divent')`.
#> ! Function arguments cannot be checked because the package divent is not attached.
#> → Add `CheckArguments=FALSE` to suppress this warning or run `library('divent')`.
#> ! Function arguments cannot be checked because the package divent is not attached.
#> → Add `CheckArguments=FALSE` to suppress this warning or run `library('divent')`.
#> ! Function arguments cannot be checked because the package divent is not attached.
#> → Add `CheckArguments=FALSE` to suppress this warning or run `library('divent')`.
#> ! Function arguments cannot be checked because the package divent is not attached.
#> → Add `CheckArguments=FALSE` to suppress this warning or run `library('divent')`.
#> ! Function arguments cannot be checked because the package divent is not attached.
#> → Add `CheckArguments=FALSE` to suppress this warning or run `library('divent')`.
#> ! Function arguments cannot be checked because the package divent is not attached.
#> → Add `CheckArguments=FALSE` to suppress this warning or run `library('divent')`.
#> ! Function arguments cannot be checked because the package divent is not attached.
#> → Add `CheckArguments=FALSE` to suppress this warning or run `library('divent')`.
#> ! Function arguments cannot be checked because the package divent is not attached.
#> → Add `CheckArguments=FALSE` to suppress this warning or run `library('divent')`.
#> ! Function arguments cannot be checked because the package divent is not attached.
#> → Add `CheckArguments=FALSE` to suppress this warning or run `library('divent')`.
#> ! Function arguments cannot be checked because the package divent is not attached.
#> → Add `CheckArguments=FALSE` to suppress this warning or run `library('divent')`.
#> ! Function arguments cannot be checked because the package divent is not attached.
#> → Add `CheckArguments=FALSE` to suppress this warning or run `library('divent')`.
#> ! Function arguments cannot be checked because the package divent is not attached.
#> → Add `CheckArguments=FALSE` to suppress this warning or run `library('divent')`.
#> ! Function arguments cannot be checked because the package divent is not attached.
#> → Add `CheckArguments=FALSE` to suppress this warning or run `library('divent')`.
#> ! Function arguments cannot be checked because the package divent is not attached.
#> → Add `CheckArguments=FALSE` to suppress this warning or run `library('divent')`.
#> ! Function arguments cannot be checked because the package divent is not attached.
#> → Add `CheckArguments=FALSE` to suppress this warning or run `library('divent')`.
#> ! Function arguments cannot be checked because the package divent is not attached.
#> → Add `CheckArguments=FALSE` to suppress this warning or run `library('divent')`.
#> ! Function arguments cannot be checked because the package divent is not attached.
#> → Add `CheckArguments=FALSE` to suppress this warning or run `library('divent')`.
#> ! Function arguments cannot be checked because the package divent is not attached.
#> → Add `CheckArguments=FALSE` to suppress this warning or run `library('divent')`.
#> ! Function arguments cannot be checked because the package divent is not attached.
#> → Add `CheckArguments=FALSE` to suppress this warning or run `library('divent')`.
#> ! Function arguments cannot be checked because the package divent is not attached.
#> → Add `CheckArguments=FALSE` to suppress this warning or run `library('divent')`.
#> ! Function arguments cannot be checked because the package divent is not attached.
#> → Add `CheckArguments=FALSE` to suppress this warning or run `library('divent')`.
#> ! Function arguments cannot be checked because the package divent is not attached.
#> → Add `CheckArguments=FALSE` to suppress this warning or run `library('divent')`.
#> ! Function arguments cannot be checked because the package divent is not attached.
#> → Add `CheckArguments=FALSE` to suppress this warning or run `library('divent')`.
#> ! Function arguments cannot be checked because the package divent is not attached.
#> → Add `CheckArguments=FALSE` to suppress this warning or run `library('divent')`.
#> ! Function arguments cannot be checked because the package divent is not attached.
#> → Add `CheckArguments=FALSE` to suppress this warning or run `library('divent')`.
#> ! Function arguments cannot be checked because the package divent is not attached.
#> → Add `CheckArguments=FALSE` to suppress this warning or run `library('divent')`.
#> ! Function arguments cannot be checked because the package divent is not attached.
#> → Add `CheckArguments=FALSE` to suppress this warning or run `library('divent')`.
#> ! Function arguments cannot be checked because the package divent is not attached.
#> → Add `CheckArguments=FALSE` to suppress this warning or run `library('divent')`.
#> ! Function arguments cannot be checked because the package divent is not attached.
#> → Add `CheckArguments=FALSE` to suppress this warning or run `library('divent')`.
#> ! Function arguments cannot be checked because the package divent is not attached.
#> → Add `CheckArguments=FALSE` to suppress this warning or run `library('divent')`.
#> ! Function arguments cannot be checked because the package divent is not attached.
#> → Add `CheckArguments=FALSE` to suppress this warning or run `library('divent')`.
#> ! Function arguments cannot be checked because the package divent is not attached.
#> → Add `CheckArguments=FALSE` to suppress this warning or run `library('divent')`.
#> ! Function arguments cannot be checked because the package divent is not attached.
#> → Add `CheckArguments=FALSE` to suppress this warning or run `library('divent')`.
#> ! Function arguments cannot be checked because the package divent is not attached.
#> → Add `CheckArguments=FALSE` to suppress this warning or run `library('divent')`.
#> ! Function arguments cannot be checked because the package divent is not attached.
#> → Add `CheckArguments=FALSE` to suppress this warning or run `library('divent')`.
#> ! Function arguments cannot be checked because the package divent is not attached.
#> → Add `CheckArguments=FALSE` to suppress this warning or run `library('divent')`.
#> ! Function arguments cannot be checked because the package divent is not attached.
#> → Add `CheckArguments=FALSE` to suppress this warning or run `library('divent')`.
#> ! Function arguments cannot be checked because the package divent is not attached.
#> → Add `CheckArguments=FALSE` to suppress this warning or run `library('divent')`.
#> ! Function arguments cannot be checked because the package divent is not attached.
#> → Add `CheckArguments=FALSE` to suppress this warning or run `library('divent')`.
#> ! Function arguments cannot be checked because the package divent is not attached.
#> → Add `CheckArguments=FALSE` to suppress this warning or run `library('divent')`.
#> ! Function arguments cannot be checked because the package divent is not attached.
#> → Add `CheckArguments=FALSE` to suppress this warning or run `library('divent')`.
#> ! Function arguments cannot be checked because the package divent is not attached.
#> → Add `CheckArguments=FALSE` to suppress this warning or run `library('divent')`.
#> ! Function arguments cannot be checked because the package divent is not attached.
#> → Add `CheckArguments=FALSE` to suppress this warning or run `library('divent')`.
#> ! Function arguments cannot be checked because the package divent is not attached.
#> → Add `CheckArguments=FALSE` to suppress this warning or run `library('divent')`.
#> ! Function arguments cannot be checked because the package divent is not attached.
#> → Add `CheckArguments=FALSE` to suppress this warning or run `library('divent')`.
#> ! Function arguments cannot be checked because the package divent is not attached.
#> → Add `CheckArguments=FALSE` to suppress this warning or run `library('divent')`.
#> ! Function arguments cannot be checked because the package divent is not attached.
#> → Add `CheckArguments=FALSE` to suppress this warning or run `library('divent')`.
#> ! Function arguments cannot be checked because the package divent is not attached.
#> → Add `CheckArguments=FALSE` to suppress this warning or run `library('divent')`.
#> ! Function arguments cannot be checked because the package divent is not attached.
#> → Add `CheckArguments=FALSE` to suppress this warning or run `library('divent')`.
#> ! Function arguments cannot be checked because the package divent is not attached.
#> → Add `CheckArguments=FALSE` to suppress this warning or run `library('divent')`.
#> ! Function arguments cannot be checked because the package divent is not attached.
#> → Add `CheckArguments=FALSE` to suppress this warning or run `library('divent')`.
#> ! Function arguments cannot be checked because the package divent is not attached.
#> → Add `CheckArguments=FALSE` to suppress this warning or run `library('divent')`.
#> ! Function arguments cannot be checked because the package divent is not attached.
#> → Add `CheckArguments=FALSE` to suppress this warning or run `library('divent')`.
#> ! Function arguments cannot be checked because the package divent is not attached.
#> → Add `CheckArguments=FALSE` to suppress this warning or run `library('divent')`.
#> ! Function arguments cannot be checked because the package divent is not attached.
#> → Add `CheckArguments=FALSE` to suppress this warning or run `library('divent')`.
#> ! Function arguments cannot be checked because the package divent is not attached.
#> → Add `CheckArguments=FALSE` to suppress this warning or run `library('divent')`.
#> ! Function arguments cannot be checked because the package divent is not attached.
#> → Add `CheckArguments=FALSE` to suppress this warning or run `library('divent')`.
#> ! Function arguments cannot be checked because the package divent is not attached.
#> → Add `CheckArguments=FALSE` to suppress this warning or run `library('divent')`.
#> ! Function arguments cannot be checked because the package divent is not attached.
#> → Add `CheckArguments=FALSE` to suppress this warning or run `library('divent')`.
#> ! Function arguments cannot be checked because the package divent is not attached.
#> → Add `CheckArguments=FALSE` to suppress this warning or run `library('divent')`.
#> ! Function arguments cannot be checked because the package divent is not attached.
#> → Add `CheckArguments=FALSE` to suppress this warning or run `library('divent')`.
#> ! Function arguments cannot be checked because the package divent is not attached.
#> → Add `CheckArguments=FALSE` to suppress this warning or run `library('divent')`.
#> ! Function arguments cannot be checked because the package divent is not attached.
#> → Add `CheckArguments=FALSE` to suppress this warning or run `library('divent')`.
#> ! Function arguments cannot be checked because the package divent is not attached.
#> → Add `CheckArguments=FALSE` to suppress this warning or run `library('divent')`.
#> ! Function arguments cannot be checked because the package divent is not attached.
#> → Add `CheckArguments=FALSE` to suppress this warning or run `library('divent')`.
#> ! Function arguments cannot be checked because the package divent is not attached.
#> → Add `CheckArguments=FALSE` to suppress this warning or run `library('divent')`.
#> ! Function arguments cannot be checked because the package divent is not attached.
#> → Add `CheckArguments=FALSE` to suppress this warning or run `library('divent')`.
#> ! Function arguments cannot be checked because the package divent is not attached.
#> → Add `CheckArguments=FALSE` to suppress this warning or run `library('divent')`.
#> ! Function arguments cannot be checked because the package divent is not attached.
#> → Add `CheckArguments=FALSE` to suppress this warning or run `library('divent')`.
#> ! Function arguments cannot be checked because the package divent is not attached.
#> → Add `CheckArguments=FALSE` to suppress this warning or run `library('divent')`.
#> ! Function arguments cannot be checked because the package divent is not attached.
#> → Add `CheckArguments=FALSE` to suppress this warning or run `library('divent')`.
#> ! Function arguments cannot be checked because the package divent is not attached.
#> → Add `CheckArguments=FALSE` to suppress this warning or run `library('divent')`.
#> ! Function arguments cannot be checked because the package divent is not attached.
#> → Add `CheckArguments=FALSE` to suppress this warning or run `library('divent')`.
#> ! Function arguments cannot be checked because the package divent is not attached.
#> → Add `CheckArguments=FALSE` to suppress this warning or run `library('divent')`.
#> ! Function arguments cannot be checked because the package divent is not attached.
#> → Add `CheckArguments=FALSE` to suppress this warning or run `library('divent')`.
#> ! Function arguments cannot be checked because the package divent is not attached.
#> → Add `CheckArguments=FALSE` to suppress this warning or run `library('divent')`.
#> ! Function arguments cannot be checked because the package divent is not attached.
#> → Add `CheckArguments=FALSE` to suppress this warning or run `library('divent')`.
#> ! Function arguments cannot be checked because the package divent is not attached.
#> → Add `CheckArguments=FALSE` to suppress this warning or run `library('divent')`.
#> ! Function arguments cannot be checked because the package divent is not attached.
#> → Add `CheckArguments=FALSE` to suppress this warning or run `library('divent')`.
#> ! Function arguments cannot be checked because the package divent is not attached.
#> → Add `CheckArguments=FALSE` to suppress this warning or run `library('divent')`.
#> ! Function arguments cannot be checked because the package divent is not attached.
#> → Add `CheckArguments=FALSE` to suppress this warning or run `library('divent')`.
#> ! Function arguments cannot be checked because the package divent is not attached.
#> → Add `CheckArguments=FALSE` to suppress this warning or run `library('divent')`.
#> ! Function arguments cannot be checked because the package divent is not attached.
#> → Add `CheckArguments=FALSE` to suppress this warning or run `library('divent')`.
#> ! Function arguments cannot be checked because the package divent is not attached.
#> → Add `CheckArguments=FALSE` to suppress this warning or run `library('divent')`.
#> ! Function arguments cannot be checked because the package divent is not attached.
#> → Add `CheckArguments=FALSE` to suppress this warning or run `library('divent')`.
#> ! Function arguments cannot be checked because the package divent is not attached.
#> → Add `CheckArguments=FALSE` to suppress this warning or run `library('divent')`.
#> ! Function arguments cannot be checked because the package divent is not attached.
#> → Add `CheckArguments=FALSE` to suppress this warning or run `library('divent')`.
#> ! Function arguments cannot be checked because the package divent is not attached.
#> → Add `CheckArguments=FALSE` to suppress this warning or run `library('divent')`.
#> ! Function arguments cannot be checked because the package divent is not attached.
#> → Add `CheckArguments=FALSE` to suppress this warning or run `library('divent')`.
#> ! Function arguments cannot be checked because the package divent is not attached.
#> → Add `CheckArguments=FALSE` to suppress this warning or run `library('divent')`.
#> ! Function arguments cannot be checked because the package divent is not attached.
#> → Add `CheckArguments=FALSE` to suppress this warning or run `library('divent')`.
#> ! Function arguments cannot be checked because the package divent is not attached.
#> → Add `CheckArguments=FALSE` to suppress this warning or run `library('divent')`.
#> ! Function arguments cannot be checked because the package divent is not attached.
#> → Add `CheckArguments=FALSE` to suppress this warning or run `library('divent')`.
#> ! Function arguments cannot be checked because the package divent is not attached.
#> → Add `CheckArguments=FALSE` to suppress this warning or run `library('divent')`.
#> ! Function arguments cannot be checked because the package divent is not attached.
#> → Add `CheckArguments=FALSE` to suppress this warning or run `library('divent')`.
#> ! Function arguments cannot be checked because the package divent is not attached.
#> → Add `CheckArguments=FALSE` to suppress this warning or run `library('divent')`.
#> ! Function arguments cannot be checked because the package divent is not attached.
#> → Add `CheckArguments=FALSE` to suppress this warning or run `library('divent')`.
#> ! Function arguments cannot be checked because the package divent is not attached.
#> → Add `CheckArguments=FALSE` to suppress this warning or run `library('divent')`.
#> ! Function arguments cannot be checked because the package divent is not attached.
#> → Add `CheckArguments=FALSE` to suppress this warning or run `library('divent')`.
#> ! Function arguments cannot be checked because the package divent is not attached.
#> → Add `CheckArguments=FALSE` to suppress this warning or run `library('divent')`.
#> ! Function arguments cannot be checked because the package divent is not attached.
#> → Add `CheckArguments=FALSE` to suppress this warning or run `library('divent')`.
#> ! Function arguments cannot be checked because the package divent is not attached.
#> → Add `CheckArguments=FALSE` to suppress this warning or run `library('divent')`.
#> ! Function arguments cannot be checked because the package divent is not attached.
#> → Add `CheckArguments=FALSE` to suppress this warning or run `library('divent')`.
#> ! Function arguments cannot be checked because the package divent is not attached.
#> → Add `CheckArguments=FALSE` to suppress this warning or run `library('divent')`.
#> ! Function arguments cannot be checked because the package divent is not attached.
#> → Add `CheckArguments=FALSE` to suppress this warning or run `library('divent')`.
#> ! Function arguments cannot be checked because the package divent is not attached.
#> → Add `CheckArguments=FALSE` to suppress this warning or run `library('divent')`.
#> ! Function arguments cannot be checked because the package divent is not attached.
#> → Add `CheckArguments=FALSE` to suppress this warning or run `library('divent')`.
#> ! Function arguments cannot be checked because the package divent is not attached.
#> → Add `CheckArguments=FALSE` to suppress this warning or run `library('divent')`.
#> ! Function arguments cannot be checked because the package divent is not attached.
#> → Add `CheckArguments=FALSE` to suppress this warning or run `library('divent')`.
#> ! Function arguments cannot be checked because the package divent is not attached.
#> → Add `CheckArguments=FALSE` to suppress this warning or run `library('divent')`.
#> ! Function arguments cannot be checked because the package divent is not attached.
#> → Add `CheckArguments=FALSE` to suppress this warning or run `library('divent')`.
#> ! Function arguments cannot be checked because the package divent is not attached.
#> → Add `CheckArguments=FALSE` to suppress this warning or run `library('divent')`.
#> ! Function arguments cannot be checked because the package divent is not attached.
#> → Add `CheckArguments=FALSE` to suppress this warning or run `library('divent')`.
#> ! Function arguments cannot be checked because the package divent is not attached.
#> → Add `CheckArguments=FALSE` to suppress this warning or run `library('divent')`.
#> ! Function arguments cannot be checked because the package divent is not attached.
#> → Add `CheckArguments=FALSE` to suppress this warning or run `library('divent')`.
#> ! Function arguments cannot be checked because the package divent is not attached.
#> → Add `CheckArguments=FALSE` to suppress this warning or run `library('divent')`.
#> ! Function arguments cannot be checked because the package divent is not attached.
#> → Add `CheckArguments=FALSE` to suppress this warning or run `library('divent')`.
#> ! Function arguments cannot be checked because the package divent is not attached.
#> → Add `CheckArguments=FALSE` to suppress this warning or run `library('divent')`.
#> ! Function arguments cannot be checked because the package divent is not attached.
#> → Add `CheckArguments=FALSE` to suppress this warning or run `library('divent')`.
#> ! Function arguments cannot be checked because the package divent is not attached.
#> → Add `CheckArguments=FALSE` to suppress this warning or run `library('divent')`.
#> ! Function arguments cannot be checked because the package divent is not attached.
#> → Add `CheckArguments=FALSE` to suppress this warning or run `library('divent')`.
#> ! Function arguments cannot be checked because the package divent is not attached.
#> → Add `CheckArguments=FALSE` to suppress this warning or run `library('divent')`.
#> ! Function arguments cannot be checked because the package divent is not attached.
#> → Add `CheckArguments=FALSE` to suppress this warning or run `library('divent')`.
#> ! Function arguments cannot be checked because the package divent is not attached.
#> → Add `CheckArguments=FALSE` to suppress this warning or run `library('divent')`.
#> ! Function arguments cannot be checked because the package divent is not attached.
#> → Add `CheckArguments=FALSE` to suppress this warning or run `library('divent')`.
#> ! Function arguments cannot be checked because the package divent is not attached.
#> → Add `CheckArguments=FALSE` to suppress this warning or run `library('divent')`.
#> ! Function arguments cannot be checked because the package divent is not attached.
#> → Add `CheckArguments=FALSE` to suppress this warning or run `library('divent')`.
#> ! Function arguments cannot be checked because the package divent is not attached.
#> → Add `CheckArguments=FALSE` to suppress this warning or run `library('divent')`.
#> ! Function arguments cannot be checked because the package divent is not attached.
#> → Add `CheckArguments=FALSE` to suppress this warning or run `library('divent')`.
#> ! Function arguments cannot be checked because the package divent is not attached.
#> → Add `CheckArguments=FALSE` to suppress this warning or run `library('divent')`.
#> ! Function arguments cannot be checked because the package divent is not attached.
#> → Add `CheckArguments=FALSE` to suppress this warning or run `library('divent')`.
#> ! Function arguments cannot be checked because the package divent is not attached.
#> → Add `CheckArguments=FALSE` to suppress this warning or run `library('divent')`.
#> ! Function arguments cannot be checked because the package divent is not attached.
#> → Add `CheckArguments=FALSE` to suppress this warning or run `library('divent')`.
#> ! Function arguments cannot be checked because the package divent is not attached.
#> → Add `CheckArguments=FALSE` to suppress this warning or run `library('divent')`.
#> ! Function arguments cannot be checked because the package divent is not attached.
#> → Add `CheckArguments=FALSE` to suppress this warning or run `library('divent')`.
#> ! Function arguments cannot be checked because the package divent is not attached.
#> → Add `CheckArguments=FALSE` to suppress this warning or run `library('divent')`.
#> ! Function arguments cannot be checked because the package divent is not attached.
#> → Add `CheckArguments=FALSE` to suppress this warning or run `library('divent')`.
#> ! Function arguments cannot be checked because the package divent is not attached.
#> → Add `CheckArguments=FALSE` to suppress this warning or run `library('divent')`.
#> ! Function arguments cannot be checked because the package divent is not attached.
#> → Add `CheckArguments=FALSE` to suppress this warning or run `library('divent')`.
#> ! Function arguments cannot be checked because the package divent is not attached.
#> → Add `CheckArguments=FALSE` to suppress this warning or run `library('divent')`.
#> ! Function arguments cannot be checked because the package divent is not attached.
#> → Add `CheckArguments=FALSE` to suppress this warning or run `library('divent')`.
#> ! Function arguments cannot be checked because the package divent is not attached.
#> → Add `CheckArguments=FALSE` to suppress this warning or run `library('divent')`.
#> ! Function arguments cannot be checked because the package divent is not attached.
#> → Add `CheckArguments=FALSE` to suppress this warning or run `library('divent')`.
#> ! Function arguments cannot be checked because the package divent is not attached.
#> → Add `CheckArguments=FALSE` to suppress this warning or run `library('divent')`.
#> ! Function arguments cannot be checked because the package divent is not attached.
#> → Add `CheckArguments=FALSE` to suppress this warning or run `library('divent')`.
#> ! Function arguments cannot be checked because the package divent is not attached.
#> → Add `CheckArguments=FALSE` to suppress this warning or run `library('divent')`.
#> ! Function arguments cannot be checked because the package divent is not attached.
#> → Add `CheckArguments=FALSE` to suppress this warning or run `library('divent')`.
#> ! Function arguments cannot be checked because the package divent is not attached.
#> → Add `CheckArguments=FALSE` to suppress this warning or run `library('divent')`.
#> ! Function arguments cannot be checked because the package divent is not attached.
#> → Add `CheckArguments=FALSE` to suppress this warning or run `library('divent')`.
#> ! Function arguments cannot be checked because the package divent is not attached.
#> → Add `CheckArguments=FALSE` to suppress this warning or run `library('divent')`.
#> ! Function arguments cannot be checked because the package divent is not attached.
#> → Add `CheckArguments=FALSE` to suppress this warning or run `library('divent')`.
#> ! Function arguments cannot be checked because the package divent is not attached.
#> → Add `CheckArguments=FALSE` to suppress this warning or run `library('divent')`.
#> ! Function arguments cannot be checked because the package divent is not attached.
#> → Add `CheckArguments=FALSE` to suppress this warning or run `library('divent')`.
#> ! Function arguments cannot be checked because the package divent is not attached.
#> → Add `CheckArguments=FALSE` to suppress this warning or run `library('divent')`.
#> ! Function arguments cannot be checked because the package divent is not attached.
#> → Add `CheckArguments=FALSE` to suppress this warning or run `library('divent')`.
#> ! Function arguments cannot be checked because the package divent is not attached.
#> → Add `CheckArguments=FALSE` to suppress this warning or run `library('divent')`.
#> ! Function arguments cannot be checked because the package divent is not attached.
#> → Add `CheckArguments=FALSE` to suppress this warning or run `library('divent')`.
#> ! Function arguments cannot be checked because the package divent is not attached.
#> → Add `CheckArguments=FALSE` to suppress this warning or run `library('divent')`.
#> ! Function arguments cannot be checked because the package divent is not attached.
#> → Add `CheckArguments=FALSE` to suppress this warning or run `library('divent')`.
#> ! Function arguments cannot be checked because the package divent is not attached.
#> → Add `CheckArguments=FALSE` to suppress this warning or run `library('divent')`.
#> ! Function arguments cannot be checked because the package divent is not attached.
#> → Add `CheckArguments=FALSE` to suppress this warning or run `library('divent')`.
#> ! Function arguments cannot be checked because the package divent is not attached.
#> → Add `CheckArguments=FALSE` to suppress this warning or run `library('divent')`.
#> ! Function arguments cannot be checked because the package divent is not attached.
#> → Add `CheckArguments=FALSE` to suppress this warning or run `library('divent')`.
#> ! Function arguments cannot be checked because the package divent is not attached.
#> → Add `CheckArguments=FALSE` to suppress this warning or run `library('divent')`.
#> ! Function arguments cannot be checked because the package divent is not attached.
#> → Add `CheckArguments=FALSE` to suppress this warning or run `library('divent')`.
#> ! Function arguments cannot be checked because the package divent is not attached.
#> → Add `CheckArguments=FALSE` to suppress this warning or run `library('divent')`.
#> ! Function arguments cannot be checked because the package divent is not attached.
#> → Add `CheckArguments=FALSE` to suppress this warning or run `library('divent')`.
#> ! Function arguments cannot be checked because the package divent is not attached.
#> → Add `CheckArguments=FALSE` to suppress this warning or run `library('divent')`.
#> ! Function arguments cannot be checked because the package divent is not attached.
#> → Add `CheckArguments=FALSE` to suppress this warning or run `library('divent')`.
#> ! Function arguments cannot be checked because the package divent is not attached.
#> → Add `CheckArguments=FALSE` to suppress this warning or run `library('divent')`.
#> ! Function arguments cannot be checked because the package divent is not attached.
#> → Add `CheckArguments=FALSE` to suppress this warning or run `library('divent')`.
#> ! Function arguments cannot be checked because the package divent is not attached.
#> → Add `CheckArguments=FALSE` to suppress this warning or run `library('divent')`.
#> ! Function arguments cannot be checked because the package divent is not attached.
#> → Add `CheckArguments=FALSE` to suppress this warning or run `library('divent')`.
#> ! Function arguments cannot be checked because the package divent is not attached.
#> → Add `CheckArguments=FALSE` to suppress this warning or run `library('divent')`.
#> ! Function arguments cannot be checked because the package divent is not attached.
#> → Add `CheckArguments=FALSE` to suppress this warning or run `library('divent')`.
#> ! Function arguments cannot be checked because the package divent is not attached.
#> → Add `CheckArguments=FALSE` to suppress this warning or run `library('divent')`.
#> ! Function arguments cannot be checked because the package divent is not attached.
#> → Add `CheckArguments=FALSE` to suppress this warning or run `library('divent')`.
#> ! Function arguments cannot be checked because the package divent is not attached.
#> → Add `CheckArguments=FALSE` to suppress this warning or run `library('divent')`.
#> ! Function arguments cannot be checked because the package divent is not attached.
#> → Add `CheckArguments=FALSE` to suppress this warning or run `library('divent')`.
#> ! Function arguments cannot be checked because the package divent is not attached.
#> → Add `CheckArguments=FALSE` to suppress this warning or run `library('divent')`.
#> ! Function arguments cannot be checked because the package divent is not attached.
#> → Add `CheckArguments=FALSE` to suppress this warning or run `library('divent')`.
#> ! Function arguments cannot be checked because the package divent is not attached.
#> → Add `CheckArguments=FALSE` to suppress this warning or run `library('divent')`.
#> ! Function arguments cannot be checked because the package divent is not attached.
#> → Add `CheckArguments=FALSE` to suppress this warning or run `library('divent')`.
#> ! Function arguments cannot be checked because the package divent is not attached.
#> → Add `CheckArguments=FALSE` to suppress this warning or run `library('divent')`.
#> ! Function arguments cannot be checked because the package divent is not attached.
#> → Add `CheckArguments=FALSE` to suppress this warning or run `library('divent')`.
#> ! Function arguments cannot be checked because the package divent is not attached.
#> → Add `CheckArguments=FALSE` to suppress this warning or run `library('divent')`.
#> ! Function arguments cannot be checked because the package divent is not attached.
#> → Add `CheckArguments=FALSE` to suppress this warning or run `library('divent')`.
#> ! Function arguments cannot be checked because the package divent is not attached.
#> → Add `CheckArguments=FALSE` to suppress this warning or run `library('divent')`.
#> ! Function arguments cannot be checked because the package divent is not attached.
#> → Add `CheckArguments=FALSE` to suppress this warning or run `library('divent')`.
#> ! Function arguments cannot be checked because the package divent is not attached.
#> → Add `CheckArguments=FALSE` to suppress this warning or run `library('divent')`.
#> ! Function arguments cannot be checked because the package divent is not attached.
#> → Add `CheckArguments=FALSE` to suppress this warning or run `library('divent')`.
#> ! Function arguments cannot be checked because the package divent is not attached.
#> → Add `CheckArguments=FALSE` to suppress this warning or run `library('divent')`.
#> ! Function arguments cannot be checked because the package divent is not attached.
#> → Add `CheckArguments=FALSE` to suppress this warning or run `library('divent')`.
#> ! Function arguments cannot be checked because the package divent is not attached.
#> → Add `CheckArguments=FALSE` to suppress this warning or run `library('divent')`.
#> ! Function arguments cannot be checked because the package divent is not attached.
#> → Add `CheckArguments=FALSE` to suppress this warning or run `library('divent')`.
#> ! Function arguments cannot be checked because the package divent is not attached.
#> → Add `CheckArguments=FALSE` to suppress this warning or run `library('divent')`.
#> ! Function arguments cannot be checked because the package divent is not attached.
#> → Add `CheckArguments=FALSE` to suppress this warning or run `library('divent')`.
#> ! Function arguments cannot be checked because the package divent is not attached.
#> → Add `CheckArguments=FALSE` to suppress this warning or run `library('divent')`.
#> ! Function arguments cannot be checked because the package divent is not attached.
#> → Add `CheckArguments=FALSE` to suppress this warning or run `library('divent')`.
#> ! Function arguments cannot be checked because the package divent is not attached.
#> → Add `CheckArguments=FALSE` to suppress this warning or run `library('divent')`.
#> ! Function arguments cannot be checked because the package divent is not attached.
#> → Add `CheckArguments=FALSE` to suppress this warning or run `library('divent')`.
#> ! Function arguments cannot be checked because the package divent is not attached.
#> → Add `CheckArguments=FALSE` to suppress this warning or run `library('divent')`.
#> ! Function arguments cannot be checked because the package divent is not attached.
#> → Add `CheckArguments=FALSE` to suppress this warning or run `library('divent')`.
#> ! Function arguments cannot be checked because the package divent is not attached.
#> → Add `CheckArguments=FALSE` to suppress this warning or run `library('divent')`.
#> ! Function arguments cannot be checked because the package divent is not attached.
#> → Add `CheckArguments=FALSE` to suppress this warning or run `library('divent')`.
#> ! Function arguments cannot be checked because the package divent is not attached.
#> → Add `CheckArguments=FALSE` to suppress this warning or run `library('divent')`.
#> ! Function arguments cannot be checked because the package divent is not attached.
#> → Add `CheckArguments=FALSE` to suppress this warning or run `library('divent')`.
#> ! Function arguments cannot be checked because the package divent is not attached.
#> → Add `CheckArguments=FALSE` to suppress this warning or run `library('divent')`.
#> ! Function arguments cannot be checked because the package divent is not attached.
#> → Add `CheckArguments=FALSE` to suppress this warning or run `library('divent')`.
#> ! Function arguments cannot be checked because the package divent is not attached.
#> → Add `CheckArguments=FALSE` to suppress this warning or run `library('divent')`.
#> ! Function arguments cannot be checked because the package divent is not attached.
#> → Add `CheckArguments=FALSE` to suppress this warning or run `library('divent')`.
#> ! Function arguments cannot be checked because the package divent is not attached.
#> → Add `CheckArguments=FALSE` to suppress this warning or run `library('divent')`.
#> ! Function arguments cannot be checked because the package divent is not attached.
#> → Add `CheckArguments=FALSE` to suppress this warning or run `library('divent')`.
#> ! Function arguments cannot be checked because the package divent is not attached.
#> → Add `CheckArguments=FALSE` to suppress this warning or run `library('divent')`.
#> ! Function arguments cannot be checked because the package divent is not attached.
#> → Add `CheckArguments=FALSE` to suppress this warning or run `library('divent')`.
#> ! Function arguments cannot be checked because the package divent is not attached.
#> → Add `CheckArguments=FALSE` to suppress this warning or run `library('divent')`.
#> ! Function arguments cannot be checked because the package divent is not attached.
#> → Add `CheckArguments=FALSE` to suppress this warning or run `library('divent')`.
#> ! Function arguments cannot be checked because the package divent is not attached.
#> → Add `CheckArguments=FALSE` to suppress this warning or run `library('divent')`.
#> ! Function arguments cannot be checked because the package divent is not attached.
#> → Add `CheckArguments=FALSE` to suppress this warning or run `library('divent')`.
#> ! Function arguments cannot be checked because the package divent is not attached.
#> → Add `CheckArguments=FALSE` to suppress this warning or run `library('divent')`.
#> ! Function arguments cannot be checked because the package divent is not attached.
#> → Add `CheckArguments=FALSE` to suppress this warning or run `library('divent')`.
#> ! Function arguments cannot be checked because the package divent is not attached.
#> → Add `CheckArguments=FALSE` to suppress this warning or run `library('divent')`.
#> ! Function arguments cannot be checked because the package divent is not attached.
#> → Add `CheckArguments=FALSE` to suppress this warning or run `library('divent')`.
#> ! Function arguments cannot be checked because the package divent is not attached.
#> → Add `CheckArguments=FALSE` to suppress this warning or run `library('divent')`.
#> ! Function arguments cannot be checked because the package divent is not attached.
#> → Add `CheckArguments=FALSE` to suppress this warning or run `library('divent')`.
#> ! Function arguments cannot be checked because the package divent is not attached.
#> → Add `CheckArguments=FALSE` to suppress this warning or run `library('divent')`.
#> ! Function arguments cannot be checked because the package divent is not attached.
#> → Add `CheckArguments=FALSE` to suppress this warning or run `library('divent')`.
#> ! Function arguments cannot be checked because the package divent is not attached.
#> → Add `CheckArguments=FALSE` to suppress this warning or run `library('divent')`.
#> ! Function arguments cannot be checked because the package divent is not attached.
#> → Add `CheckArguments=FALSE` to suppress this warning or run `library('divent')`.
#> ! Function arguments cannot be checked because the package divent is not attached.
#> → Add `CheckArguments=FALSE` to suppress this warning or run `library('divent')`.
#> ! Function arguments cannot be checked because the package divent is not attached.
#> → Add `CheckArguments=FALSE` to suppress this warning or run `library('divent')`.
#> ! Function arguments cannot be checked because the package divent is not attached.
#> → Add `CheckArguments=FALSE` to suppress this warning or run `library('divent')`.
#> ! Function arguments cannot be checked because the package divent is not attached.
#> → Add `CheckArguments=FALSE` to suppress this warning or run `library('divent')`.
#> ! Function arguments cannot be checked because the package divent is not attached.
#> → Add `CheckArguments=FALSE` to suppress this warning or run `library('divent')`.
#> ! Function arguments cannot be checked because the package divent is not attached.
#> → Add `CheckArguments=FALSE` to suppress this warning or run `library('divent')`.
#> ! Function arguments cannot be checked because the package divent is not attached.
#> → Add `CheckArguments=FALSE` to suppress this warning or run `library('divent')`.
#> ! Function arguments cannot be checked because the package divent is not attached.
#> → Add `CheckArguments=FALSE` to suppress this warning or run `library('divent')`.
#> ! Function arguments cannot be checked because the package divent is not attached.
#> → Add `CheckArguments=FALSE` to suppress this warning or run `library('divent')`.
#> ! Function arguments cannot be checked because the package divent is not attached.
#> → Add `CheckArguments=FALSE` to suppress this warning or run `library('divent')`.
#> ! Function arguments cannot be checked because the package divent is not attached.
#> → Add `CheckArguments=FALSE` to suppress this warning or run `library('divent')`.
#> ! Function arguments cannot be checked because the package divent is not attached.
#> → Add `CheckArguments=FALSE` to suppress this warning or run `library('divent')`.
#> ! Function arguments cannot be checked because the package divent is not attached.
#> → Add `CheckArguments=FALSE` to suppress this warning or run `library('divent')`.
#> ! Function arguments cannot be checked because the package divent is not attached.
#> → Add `CheckArguments=FALSE` to suppress this warning or run `library('divent')`.
#> ! Function arguments cannot be checked because the package divent is not attached.
#> → Add `CheckArguments=FALSE` to suppress this warning or run `library('divent')`.
#> ! Function arguments cannot be checked because the package divent is not attached.
#> → Add `CheckArguments=FALSE` to suppress this warning or run `library('divent')`.
#> ! Function arguments cannot be checked because the package divent is not attached.
#> → Add `CheckArguments=FALSE` to suppress this warning or run `library('divent')`.
#> ! Function arguments cannot be checked because the package divent is not attached.
#> → Add `CheckArguments=FALSE` to suppress this warning or run `library('divent')`.
#> Warning: Removed 2 rows containing missing values or values outside the scale range
#> (`geom_boot_ci()`).
#> Warning: Removed 2 rows containing missing values or values outside the scale range
#> (`geom_boot_ci()`).
#> Warning: Removed 2 rows containing missing values or values outside the scale range
#> (`geom_boot_ci()`).
#> → Processing: fungi_rarefy
#> ! Function arguments cannot be checked because the package divent is not attached.
#> → Add `CheckArguments=FALSE` to suppress this warning or run `library('divent')`.
#> ! Function arguments cannot be checked because the package divent is not attached.
#> → Add `CheckArguments=FALSE` to suppress this warning or run `library('divent')`.
#> ! Function arguments cannot be checked because the package divent is not attached.
#> → Add `CheckArguments=FALSE` to suppress this warning or run `library('divent')`.
#> ! Function arguments cannot be checked because the package divent is not attached.
#> → Add `CheckArguments=FALSE` to suppress this warning or run `library('divent')`.
#> ! Function arguments cannot be checked because the package divent is not attached.
#> → Add `CheckArguments=FALSE` to suppress this warning or run `library('divent')`.
#> ! Function arguments cannot be checked because the package divent is not attached.
#> → Add `CheckArguments=FALSE` to suppress this warning or run `library('divent')`.
#> ! Function arguments cannot be checked because the package divent is not attached.
#> → Add `CheckArguments=FALSE` to suppress this warning or run `library('divent')`.
#> ! Function arguments cannot be checked because the package divent is not attached.
#> → Add `CheckArguments=FALSE` to suppress this warning or run `library('divent')`.
#> ! Function arguments cannot be checked because the package divent is not attached.
#> → Add `CheckArguments=FALSE` to suppress this warning or run `library('divent')`.
#> ! Function arguments cannot be checked because the package divent is not attached.
#> → Add `CheckArguments=FALSE` to suppress this warning or run `library('divent')`.
#> ! Function arguments cannot be checked because the package divent is not attached.
#> → Add `CheckArguments=FALSE` to suppress this warning or run `library('divent')`.
#> ! Function arguments cannot be checked because the package divent is not attached.
#> → Add `CheckArguments=FALSE` to suppress this warning or run `library('divent')`.
#> ! Function arguments cannot be checked because the package divent is not attached.
#> → Add `CheckArguments=FALSE` to suppress this warning or run `library('divent')`.
#> ! Function arguments cannot be checked because the package divent is not attached.
#> → Add `CheckArguments=FALSE` to suppress this warning or run `library('divent')`.
#> ! Function arguments cannot be checked because the package divent is not attached.
#> → Add `CheckArguments=FALSE` to suppress this warning or run `library('divent')`.
#> ! Function arguments cannot be checked because the package divent is not attached.
#> → Add `CheckArguments=FALSE` to suppress this warning or run `library('divent')`.
#> ! Function arguments cannot be checked because the package divent is not attached.
#> → Add `CheckArguments=FALSE` to suppress this warning or run `library('divent')`.
#> ! Function arguments cannot be checked because the package divent is not attached.
#> → Add `CheckArguments=FALSE` to suppress this warning or run `library('divent')`.
#> ! Function arguments cannot be checked because the package divent is not attached.
#> → Add `CheckArguments=FALSE` to suppress this warning or run `library('divent')`.
#> ! Function arguments cannot be checked because the package divent is not attached.
#> → Add `CheckArguments=FALSE` to suppress this warning or run `library('divent')`.
#> ! Function arguments cannot be checked because the package divent is not attached.
#> → Add `CheckArguments=FALSE` to suppress this warning or run `library('divent')`.
#> ! Function arguments cannot be checked because the package divent is not attached.
#> → Add `CheckArguments=FALSE` to suppress this warning or run `library('divent')`.
#> ! Function arguments cannot be checked because the package divent is not attached.
#> → Add `CheckArguments=FALSE` to suppress this warning or run `library('divent')`.
#> ! Function arguments cannot be checked because the package divent is not attached.
#> → Add `CheckArguments=FALSE` to suppress this warning or run `library('divent')`.
#> ! Function arguments cannot be checked because the package divent is not attached.
#> → Add `CheckArguments=FALSE` to suppress this warning or run `library('divent')`.
#> ! Function arguments cannot be checked because the package divent is not attached.
#> → Add `CheckArguments=FALSE` to suppress this warning or run `library('divent')`.
#> ! Function arguments cannot be checked because the package divent is not attached.
#> → Add `CheckArguments=FALSE` to suppress this warning or run `library('divent')`.
#> ! Function arguments cannot be checked because the package divent is not attached.
#> → Add `CheckArguments=FALSE` to suppress this warning or run `library('divent')`.
#> ! Function arguments cannot be checked because the package divent is not attached.
#> → Add `CheckArguments=FALSE` to suppress this warning or run `library('divent')`.
#> ! Function arguments cannot be checked because the package divent is not attached.
#> → Add `CheckArguments=FALSE` to suppress this warning or run `library('divent')`.
#> ! Function arguments cannot be checked because the package divent is not attached.
#> → Add `CheckArguments=FALSE` to suppress this warning or run `library('divent')`.
#> ! Function arguments cannot be checked because the package divent is not attached.
#> → Add `CheckArguments=FALSE` to suppress this warning or run `library('divent')`.
#> ! Function arguments cannot be checked because the package divent is not attached.
#> → Add `CheckArguments=FALSE` to suppress this warning or run `library('divent')`.
#> ! Function arguments cannot be checked because the package divent is not attached.
#> → Add `CheckArguments=FALSE` to suppress this warning or run `library('divent')`.
#> ! Function arguments cannot be checked because the package divent is not attached.
#> → Add `CheckArguments=FALSE` to suppress this warning or run `library('divent')`.
#> ! Function arguments cannot be checked because the package divent is not attached.
#> → Add `CheckArguments=FALSE` to suppress this warning or run `library('divent')`.
#> ! Function arguments cannot be checked because the package divent is not attached.
#> → Add `CheckArguments=FALSE` to suppress this warning or run `library('divent')`.
#> ! Function arguments cannot be checked because the package divent is not attached.
#> → Add `CheckArguments=FALSE` to suppress this warning or run `library('divent')`.
#> ! Function arguments cannot be checked because the package divent is not attached.
#> → Add `CheckArguments=FALSE` to suppress this warning or run `library('divent')`.
#> ! Function arguments cannot be checked because the package divent is not attached.
#> → Add `CheckArguments=FALSE` to suppress this warning or run `library('divent')`.
#> ! Function arguments cannot be checked because the package divent is not attached.
#> → Add `CheckArguments=FALSE` to suppress this warning or run `library('divent')`.
#> ! Function arguments cannot be checked because the package divent is not attached.
#> → Add `CheckArguments=FALSE` to suppress this warning or run `library('divent')`.
#> ! Function arguments cannot be checked because the package divent is not attached.
#> → Add `CheckArguments=FALSE` to suppress this warning or run `library('divent')`.
#> ! Function arguments cannot be checked because the package divent is not attached.
#> → Add `CheckArguments=FALSE` to suppress this warning or run `library('divent')`.
#> ! Function arguments cannot be checked because the package divent is not attached.
#> → Add `CheckArguments=FALSE` to suppress this warning or run `library('divent')`.
#> ! Function arguments cannot be checked because the package divent is not attached.
#> → Add `CheckArguments=FALSE` to suppress this warning or run `library('divent')`.
#> ! Function arguments cannot be checked because the package divent is not attached.
#> → Add `CheckArguments=FALSE` to suppress this warning or run `library('divent')`.
#> ! Function arguments cannot be checked because the package divent is not attached.
#> → Add `CheckArguments=FALSE` to suppress this warning or run `library('divent')`.
#> ! Function arguments cannot be checked because the package divent is not attached.
#> → Add `CheckArguments=FALSE` to suppress this warning or run `library('divent')`.
#> ! Function arguments cannot be checked because the package divent is not attached.
#> → Add `CheckArguments=FALSE` to suppress this warning or run `library('divent')`.
#> ! Function arguments cannot be checked because the package divent is not attached.
#> → Add `CheckArguments=FALSE` to suppress this warning or run `library('divent')`.
#> ! Function arguments cannot be checked because the package divent is not attached.
#> → Add `CheckArguments=FALSE` to suppress this warning or run `library('divent')`.
#> ! Function arguments cannot be checked because the package divent is not attached.
#> → Add `CheckArguments=FALSE` to suppress this warning or run `library('divent')`.
#> ! Function arguments cannot be checked because the package divent is not attached.
#> → Add `CheckArguments=FALSE` to suppress this warning or run `library('divent')`.
#> ! Function arguments cannot be checked because the package divent is not attached.
#> → Add `CheckArguments=FALSE` to suppress this warning or run `library('divent')`.
#> ! Function arguments cannot be checked because the package divent is not attached.
#> → Add `CheckArguments=FALSE` to suppress this warning or run `library('divent')`.
#> ! Function arguments cannot be checked because the package divent is not attached.
#> → Add `CheckArguments=FALSE` to suppress this warning or run `library('divent')`.
#> ! Function arguments cannot be checked because the package divent is not attached.
#> → Add `CheckArguments=FALSE` to suppress this warning or run `library('divent')`.
#> Warning: NaNs produced
#> ! Function arguments cannot be checked because the package divent is not attached.
#> → Add `CheckArguments=FALSE` to suppress this warning or run `library('divent')`.
#> Warning: NaNs produced
#> ! Function arguments cannot be checked because the package divent is not attached.
#> → Add `CheckArguments=FALSE` to suppress this warning or run `library('divent')`.
#> Warning: NaNs produced
#> ! Function arguments cannot be checked because the package divent is not attached.
#> → Add `CheckArguments=FALSE` to suppress this warning or run `library('divent')`.
#> ! Function arguments cannot be checked because the package divent is not attached.
#> → Add `CheckArguments=FALSE` to suppress this warning or run `library('divent')`.
#> ! Function arguments cannot be checked because the package divent is not attached.
#> → Add `CheckArguments=FALSE` to suppress this warning or run `library('divent')`.
#> ! Function arguments cannot be checked because the package divent is not attached.
#> → Add `CheckArguments=FALSE` to suppress this warning or run `library('divent')`.
#> ! Function arguments cannot be checked because the package divent is not attached.
#> → Add `CheckArguments=FALSE` to suppress this warning or run `library('divent')`.
#> ! Function arguments cannot be checked because the package divent is not attached.
#> → Add `CheckArguments=FALSE` to suppress this warning or run `library('divent')`.
#> ! Function arguments cannot be checked because the package divent is not attached.
#> → Add `CheckArguments=FALSE` to suppress this warning or run `library('divent')`.
#> ! Function arguments cannot be checked because the package divent is not attached.
#> → Add `CheckArguments=FALSE` to suppress this warning or run `library('divent')`.
#> ! Function arguments cannot be checked because the package divent is not attached.
#> → Add `CheckArguments=FALSE` to suppress this warning or run `library('divent')`.
#> ! Function arguments cannot be checked because the package divent is not attached.
#> → Add `CheckArguments=FALSE` to suppress this warning or run `library('divent')`.
#> ! Function arguments cannot be checked because the package divent is not attached.
#> → Add `CheckArguments=FALSE` to suppress this warning or run `library('divent')`.
#> ! Function arguments cannot be checked because the package divent is not attached.
#> → Add `CheckArguments=FALSE` to suppress this warning or run `library('divent')`.
#> ! Function arguments cannot be checked because the package divent is not attached.
#> → Add `CheckArguments=FALSE` to suppress this warning or run `library('divent')`.
#> ! Function arguments cannot be checked because the package divent is not attached.
#> → Add `CheckArguments=FALSE` to suppress this warning or run `library('divent')`.
#> ! Function arguments cannot be checked because the package divent is not attached.
#> → Add `CheckArguments=FALSE` to suppress this warning or run `library('divent')`.
#> ! Function arguments cannot be checked because the package divent is not attached.
#> → Add `CheckArguments=FALSE` to suppress this warning or run `library('divent')`.
#> ! Function arguments cannot be checked because the package divent is not attached.
#> → Add `CheckArguments=FALSE` to suppress this warning or run `library('divent')`.
#> ! Function arguments cannot be checked because the package divent is not attached.
#> → Add `CheckArguments=FALSE` to suppress this warning or run `library('divent')`.
#> ! Function arguments cannot be checked because the package divent is not attached.
#> → Add `CheckArguments=FALSE` to suppress this warning or run `library('divent')`.
#> ! Function arguments cannot be checked because the package divent is not attached.
#> → Add `CheckArguments=FALSE` to suppress this warning or run `library('divent')`.
#> ! Function arguments cannot be checked because the package divent is not attached.
#> → Add `CheckArguments=FALSE` to suppress this warning or run `library('divent')`.
#> ! Function arguments cannot be checked because the package divent is not attached.
#> → Add `CheckArguments=FALSE` to suppress this warning or run `library('divent')`.
#> ! Function arguments cannot be checked because the package divent is not attached.
#> → Add `CheckArguments=FALSE` to suppress this warning or run `library('divent')`.
#> ! Function arguments cannot be checked because the package divent is not attached.
#> → Add `CheckArguments=FALSE` to suppress this warning or run `library('divent')`.
#> ! Function arguments cannot be checked because the package divent is not attached.
#> → Add `CheckArguments=FALSE` to suppress this warning or run `library('divent')`.
#> ! Function arguments cannot be checked because the package divent is not attached.
#> → Add `CheckArguments=FALSE` to suppress this warning or run `library('divent')`.
#> ! Function arguments cannot be checked because the package divent is not attached.
#> → Add `CheckArguments=FALSE` to suppress this warning or run `library('divent')`.
#> ! Function arguments cannot be checked because the package divent is not attached.
#> → Add `CheckArguments=FALSE` to suppress this warning or run `library('divent')`.
#> ! Function arguments cannot be checked because the package divent is not attached.
#> → Add `CheckArguments=FALSE` to suppress this warning or run `library('divent')`.
#> ! Function arguments cannot be checked because the package divent is not attached.
#> → Add `CheckArguments=FALSE` to suppress this warning or run `library('divent')`.
#> ! Function arguments cannot be checked because the package divent is not attached.
#> → Add `CheckArguments=FALSE` to suppress this warning or run `library('divent')`.
#> ! Function arguments cannot be checked because the package divent is not attached.
#> → Add `CheckArguments=FALSE` to suppress this warning or run `library('divent')`.
#> ! Function arguments cannot be checked because the package divent is not attached.
#> → Add `CheckArguments=FALSE` to suppress this warning or run `library('divent')`.
#> ! Function arguments cannot be checked because the package divent is not attached.
#> → Add `CheckArguments=FALSE` to suppress this warning or run `library('divent')`.
#> ! Function arguments cannot be checked because the package divent is not attached.
#> → Add `CheckArguments=FALSE` to suppress this warning or run `library('divent')`.
#> ! Function arguments cannot be checked because the package divent is not attached.
#> → Add `CheckArguments=FALSE` to suppress this warning or run `library('divent')`.
#> ! Function arguments cannot be checked because the package divent is not attached.
#> → Add `CheckArguments=FALSE` to suppress this warning or run `library('divent')`.
#> ! Function arguments cannot be checked because the package divent is not attached.
#> → Add `CheckArguments=FALSE` to suppress this warning or run `library('divent')`.
#> ! Function arguments cannot be checked because the package divent is not attached.
#> → Add `CheckArguments=FALSE` to suppress this warning or run `library('divent')`.
#> ! Function arguments cannot be checked because the package divent is not attached.
#> → Add `CheckArguments=FALSE` to suppress this warning or run `library('divent')`.
#> ! Function arguments cannot be checked because the package divent is not attached.
#> → Add `CheckArguments=FALSE` to suppress this warning or run `library('divent')`.
#> ! Function arguments cannot be checked because the package divent is not attached.
#> → Add `CheckArguments=FALSE` to suppress this warning or run `library('divent')`.
#> ! Function arguments cannot be checked because the package divent is not attached.
#> → Add `CheckArguments=FALSE` to suppress this warning or run `library('divent')`.
#> ! Function arguments cannot be checked because the package divent is not attached.
#> → Add `CheckArguments=FALSE` to suppress this warning or run `library('divent')`.
#> ! Function arguments cannot be checked because the package divent is not attached.
#> → Add `CheckArguments=FALSE` to suppress this warning or run `library('divent')`.
#> ! Function arguments cannot be checked because the package divent is not attached.
#> → Add `CheckArguments=FALSE` to suppress this warning or run `library('divent')`.
#> ! Function arguments cannot be checked because the package divent is not attached.
#> → Add `CheckArguments=FALSE` to suppress this warning or run `library('divent')`.
#> ! Function arguments cannot be checked because the package divent is not attached.
#> → Add `CheckArguments=FALSE` to suppress this warning or run `library('divent')`.
#> ! Function arguments cannot be checked because the package divent is not attached.
#> → Add `CheckArguments=FALSE` to suppress this warning or run `library('divent')`.
#> ! Function arguments cannot be checked because the package divent is not attached.
#> → Add `CheckArguments=FALSE` to suppress this warning or run `library('divent')`.
#> ! Function arguments cannot be checked because the package divent is not attached.
#> → Add `CheckArguments=FALSE` to suppress this warning or run `library('divent')`.
#> ! Function arguments cannot be checked because the package divent is not attached.
#> → Add `CheckArguments=FALSE` to suppress this warning or run `library('divent')`.
#> ! Function arguments cannot be checked because the package divent is not attached.
#> → Add `CheckArguments=FALSE` to suppress this warning or run `library('divent')`.
#> ! Function arguments cannot be checked because the package divent is not attached.
#> → Add `CheckArguments=FALSE` to suppress this warning or run `library('divent')`.
#> ! Function arguments cannot be checked because the package divent is not attached.
#> → Add `CheckArguments=FALSE` to suppress this warning or run `library('divent')`.
#> ! Function arguments cannot be checked because the package divent is not attached.
#> → Add `CheckArguments=FALSE` to suppress this warning or run `library('divent')`.
#> ! Function arguments cannot be checked because the package divent is not attached.
#> → Add `CheckArguments=FALSE` to suppress this warning or run `library('divent')`.
#> ! Function arguments cannot be checked because the package divent is not attached.
#> → Add `CheckArguments=FALSE` to suppress this warning or run `library('divent')`.
#> ! Function arguments cannot be checked because the package divent is not attached.
#> → Add `CheckArguments=FALSE` to suppress this warning or run `library('divent')`.
#> ! Function arguments cannot be checked because the package divent is not attached.
#> → Add `CheckArguments=FALSE` to suppress this warning or run `library('divent')`.
#> ! Function arguments cannot be checked because the package divent is not attached.
#> → Add `CheckArguments=FALSE` to suppress this warning or run `library('divent')`.
#> ! Function arguments cannot be checked because the package divent is not attached.
#> → Add `CheckArguments=FALSE` to suppress this warning or run `library('divent')`.
#> ! Function arguments cannot be checked because the package divent is not attached.
#> → Add `CheckArguments=FALSE` to suppress this warning or run `library('divent')`.
#> ! Function arguments cannot be checked because the package divent is not attached.
#> → Add `CheckArguments=FALSE` to suppress this warning or run `library('divent')`.
#> ! Function arguments cannot be checked because the package divent is not attached.
#> → Add `CheckArguments=FALSE` to suppress this warning or run `library('divent')`.
#> ! Function arguments cannot be checked because the package divent is not attached.
#> → Add `CheckArguments=FALSE` to suppress this warning or run `library('divent')`.
#> ! Function arguments cannot be checked because the package divent is not attached.
#> → Add `CheckArguments=FALSE` to suppress this warning or run `library('divent')`.
#> ! Function arguments cannot be checked because the package divent is not attached.
#> → Add `CheckArguments=FALSE` to suppress this warning or run `library('divent')`.
#> ! Function arguments cannot be checked because the package divent is not attached.
#> → Add `CheckArguments=FALSE` to suppress this warning or run `library('divent')`.
#> ! Function arguments cannot be checked because the package divent is not attached.
#> → Add `CheckArguments=FALSE` to suppress this warning or run `library('divent')`.
#> ! Function arguments cannot be checked because the package divent is not attached.
#> → Add `CheckArguments=FALSE` to suppress this warning or run `library('divent')`.
#> ! Function arguments cannot be checked because the package divent is not attached.
#> → Add `CheckArguments=FALSE` to suppress this warning or run `library('divent')`.
#> ! Function arguments cannot be checked because the package divent is not attached.
#> → Add `CheckArguments=FALSE` to suppress this warning or run `library('divent')`.
#> ! Function arguments cannot be checked because the package divent is not attached.
#> → Add `CheckArguments=FALSE` to suppress this warning or run `library('divent')`.
#> ! Function arguments cannot be checked because the package divent is not attached.
#> → Add `CheckArguments=FALSE` to suppress this warning or run `library('divent')`.
#> ! Function arguments cannot be checked because the package divent is not attached.
#> → Add `CheckArguments=FALSE` to suppress this warning or run `library('divent')`.
#> ! Function arguments cannot be checked because the package divent is not attached.
#> → Add `CheckArguments=FALSE` to suppress this warning or run `library('divent')`.
#> ! Function arguments cannot be checked because the package divent is not attached.
#> → Add `CheckArguments=FALSE` to suppress this warning or run `library('divent')`.
#> ! Function arguments cannot be checked because the package divent is not attached.
#> → Add `CheckArguments=FALSE` to suppress this warning or run `library('divent')`.
#> ! Function arguments cannot be checked because the package divent is not attached.
#> → Add `CheckArguments=FALSE` to suppress this warning or run `library('divent')`.
#> ! Function arguments cannot be checked because the package divent is not attached.
#> → Add `CheckArguments=FALSE` to suppress this warning or run `library('divent')`.
#> ! Function arguments cannot be checked because the package divent is not attached.
#> → Add `CheckArguments=FALSE` to suppress this warning or run `library('divent')`.
#> ! Function arguments cannot be checked because the package divent is not attached.
#> → Add `CheckArguments=FALSE` to suppress this warning or run `library('divent')`.
#> ! Function arguments cannot be checked because the package divent is not attached.
#> → Add `CheckArguments=FALSE` to suppress this warning or run `library('divent')`.
#> ! Function arguments cannot be checked because the package divent is not attached.
#> → Add `CheckArguments=FALSE` to suppress this warning or run `library('divent')`.
#> ! Function arguments cannot be checked because the package divent is not attached.
#> → Add `CheckArguments=FALSE` to suppress this warning or run `library('divent')`.
#> ! Function arguments cannot be checked because the package divent is not attached.
#> → Add `CheckArguments=FALSE` to suppress this warning or run `library('divent')`.
#> ! Function arguments cannot be checked because the package divent is not attached.
#> → Add `CheckArguments=FALSE` to suppress this warning or run `library('divent')`.
#> ! Function arguments cannot be checked because the package divent is not attached.
#> → Add `CheckArguments=FALSE` to suppress this warning or run `library('divent')`.
#> ! Function arguments cannot be checked because the package divent is not attached.
#> → Add `CheckArguments=FALSE` to suppress this warning or run `library('divent')`.
#> ! Function arguments cannot be checked because the package divent is not attached.
#> → Add `CheckArguments=FALSE` to suppress this warning or run `library('divent')`.
#> ! Function arguments cannot be checked because the package divent is not attached.
#> → Add `CheckArguments=FALSE` to suppress this warning or run `library('divent')`.
#> ! Function arguments cannot be checked because the package divent is not attached.
#> → Add `CheckArguments=FALSE` to suppress this warning or run `library('divent')`.
#> ! Function arguments cannot be checked because the package divent is not attached.
#> → Add `CheckArguments=FALSE` to suppress this warning or run `library('divent')`.
#> ! Function arguments cannot be checked because the package divent is not attached.
#> → Add `CheckArguments=FALSE` to suppress this warning or run `library('divent')`.
#> ! Function arguments cannot be checked because the package divent is not attached.
#> → Add `CheckArguments=FALSE` to suppress this warning or run `library('divent')`.
#> ! Function arguments cannot be checked because the package divent is not attached.
#> → Add `CheckArguments=FALSE` to suppress this warning or run `library('divent')`.
#> ! Function arguments cannot be checked because the package divent is not attached.
#> → Add `CheckArguments=FALSE` to suppress this warning or run `library('divent')`.
#> ! Function arguments cannot be checked because the package divent is not attached.
#> → Add `CheckArguments=FALSE` to suppress this warning or run `library('divent')`.
#> ! Function arguments cannot be checked because the package divent is not attached.
#> → Add `CheckArguments=FALSE` to suppress this warning or run `library('divent')`.
#> ! Function arguments cannot be checked because the package divent is not attached.
#> → Add `CheckArguments=FALSE` to suppress this warning or run `library('divent')`.
#> ! Function arguments cannot be checked because the package divent is not attached.
#> → Add `CheckArguments=FALSE` to suppress this warning or run `library('divent')`.
#> ! Function arguments cannot be checked because the package divent is not attached.
#> → Add `CheckArguments=FALSE` to suppress this warning or run `library('divent')`.
#> ! Function arguments cannot be checked because the package divent is not attached.
#> → Add `CheckArguments=FALSE` to suppress this warning or run `library('divent')`.
#> ! Function arguments cannot be checked because the package divent is not attached.
#> → Add `CheckArguments=FALSE` to suppress this warning or run `library('divent')`.
#> ! Function arguments cannot be checked because the package divent is not attached.
#> → Add `CheckArguments=FALSE` to suppress this warning or run `library('divent')`.
#> ! Function arguments cannot be checked because the package divent is not attached.
#> → Add `CheckArguments=FALSE` to suppress this warning or run `library('divent')`.
#> ! Function arguments cannot be checked because the package divent is not attached.
#> → Add `CheckArguments=FALSE` to suppress this warning or run `library('divent')`.
#> ! Function arguments cannot be checked because the package divent is not attached.
#> → Add `CheckArguments=FALSE` to suppress this warning or run `library('divent')`.
#> ! Function arguments cannot be checked because the package divent is not attached.
#> → Add `CheckArguments=FALSE` to suppress this warning or run `library('divent')`.
#> ! Function arguments cannot be checked because the package divent is not attached.
#> → Add `CheckArguments=FALSE` to suppress this warning or run `library('divent')`.
#> ! Function arguments cannot be checked because the package divent is not attached.
#> → Add `CheckArguments=FALSE` to suppress this warning or run `library('divent')`.
#> ! Function arguments cannot be checked because the package divent is not attached.
#> → Add `CheckArguments=FALSE` to suppress this warning or run `library('divent')`.
#> ! Function arguments cannot be checked because the package divent is not attached.
#> → Add `CheckArguments=FALSE` to suppress this warning or run `library('divent')`.
#> ! Function arguments cannot be checked because the package divent is not attached.
#> → Add `CheckArguments=FALSE` to suppress this warning or run `library('divent')`.
#> ! Function arguments cannot be checked because the package divent is not attached.
#> → Add `CheckArguments=FALSE` to suppress this warning or run `library('divent')`.
#> ! Function arguments cannot be checked because the package divent is not attached.
#> → Add `CheckArguments=FALSE` to suppress this warning or run `library('divent')`.
#> ! Function arguments cannot be checked because the package divent is not attached.
#> → Add `CheckArguments=FALSE` to suppress this warning or run `library('divent')`.
#> ! Function arguments cannot be checked because the package divent is not attached.
#> → Add `CheckArguments=FALSE` to suppress this warning or run `library('divent')`.
#> ! Function arguments cannot be checked because the package divent is not attached.
#> → Add `CheckArguments=FALSE` to suppress this warning or run `library('divent')`.
#> ! Function arguments cannot be checked because the package divent is not attached.
#> → Add `CheckArguments=FALSE` to suppress this warning or run `library('divent')`.
#> ! Function arguments cannot be checked because the package divent is not attached.
#> → Add `CheckArguments=FALSE` to suppress this warning or run `library('divent')`.
#> ! Function arguments cannot be checked because the package divent is not attached.
#> → Add `CheckArguments=FALSE` to suppress this warning or run `library('divent')`.
#> ! Function arguments cannot be checked because the package divent is not attached.
#> → Add `CheckArguments=FALSE` to suppress this warning or run `library('divent')`.
#> ! Function arguments cannot be checked because the package divent is not attached.
#> → Add `CheckArguments=FALSE` to suppress this warning or run `library('divent')`.
#> ! Function arguments cannot be checked because the package divent is not attached.
#> → Add `CheckArguments=FALSE` to suppress this warning or run `library('divent')`.
#> ! Function arguments cannot be checked because the package divent is not attached.
#> → Add `CheckArguments=FALSE` to suppress this warning or run `library('divent')`.
#> ! Function arguments cannot be checked because the package divent is not attached.
#> → Add `CheckArguments=FALSE` to suppress this warning or run `library('divent')`.
#> ! Function arguments cannot be checked because the package divent is not attached.
#> → Add `CheckArguments=FALSE` to suppress this warning or run `library('divent')`.
#> ! Function arguments cannot be checked because the package divent is not attached.
#> → Add `CheckArguments=FALSE` to suppress this warning or run `library('divent')`.
#> ! Function arguments cannot be checked because the package divent is not attached.
#> → Add `CheckArguments=FALSE` to suppress this warning or run `library('divent')`.
#> ! Function arguments cannot be checked because the package divent is not attached.
#> → Add `CheckArguments=FALSE` to suppress this warning or run `library('divent')`.
#> ! Function arguments cannot be checked because the package divent is not attached.
#> → Add `CheckArguments=FALSE` to suppress this warning or run `library('divent')`.
#> ! Function arguments cannot be checked because the package divent is not attached.
#> → Add `CheckArguments=FALSE` to suppress this warning or run `library('divent')`.
#> ! Function arguments cannot be checked because the package divent is not attached.
#> → Add `CheckArguments=FALSE` to suppress this warning or run `library('divent')`.
#> ! Function arguments cannot be checked because the package divent is not attached.
#> → Add `CheckArguments=FALSE` to suppress this warning or run `library('divent')`.
#> ! Function arguments cannot be checked because the package divent is not attached.
#> → Add `CheckArguments=FALSE` to suppress this warning or run `library('divent')`.
#> ! Function arguments cannot be checked because the package divent is not attached.
#> → Add `CheckArguments=FALSE` to suppress this warning or run `library('divent')`.
#> ! Function arguments cannot be checked because the package divent is not attached.
#> → Add `CheckArguments=FALSE` to suppress this warning or run `library('divent')`.
#> ! Function arguments cannot be checked because the package divent is not attached.
#> → Add `CheckArguments=FALSE` to suppress this warning or run `library('divent')`.
#> ! Function arguments cannot be checked because the package divent is not attached.
#> → Add `CheckArguments=FALSE` to suppress this warning or run `library('divent')`.
#> ! Function arguments cannot be checked because the package divent is not attached.
#> → Add `CheckArguments=FALSE` to suppress this warning or run `library('divent')`.
#> ! Function arguments cannot be checked because the package divent is not attached.
#> → Add `CheckArguments=FALSE` to suppress this warning or run `library('divent')`.
#> ! Function arguments cannot be checked because the package divent is not attached.
#> → Add `CheckArguments=FALSE` to suppress this warning or run `library('divent')`.
#> ! Function arguments cannot be checked because the package divent is not attached.
#> → Add `CheckArguments=FALSE` to suppress this warning or run `library('divent')`.
#> ! Function arguments cannot be checked because the package divent is not attached.
#> → Add `CheckArguments=FALSE` to suppress this warning or run `library('divent')`.
#> ! Function arguments cannot be checked because the package divent is not attached.
#> → Add `CheckArguments=FALSE` to suppress this warning or run `library('divent')`.
#> ! Function arguments cannot be checked because the package divent is not attached.
#> → Add `CheckArguments=FALSE` to suppress this warning or run `library('divent')`.
#> ! Function arguments cannot be checked because the package divent is not attached.
#> → Add `CheckArguments=FALSE` to suppress this warning or run `library('divent')`.
#> ! Function arguments cannot be checked because the package divent is not attached.
#> → Add `CheckArguments=FALSE` to suppress this warning or run `library('divent')`.
#> ! Function arguments cannot be checked because the package divent is not attached.
#> → Add `CheckArguments=FALSE` to suppress this warning or run `library('divent')`.
#> ! Function arguments cannot be checked because the package divent is not attached.
#> → Add `CheckArguments=FALSE` to suppress this warning or run `library('divent')`.
#> ! Function arguments cannot be checked because the package divent is not attached.
#> → Add `CheckArguments=FALSE` to suppress this warning or run `library('divent')`.
#> ! Function arguments cannot be checked because the package divent is not attached.
#> → Add `CheckArguments=FALSE` to suppress this warning or run `library('divent')`.
#> ! Function arguments cannot be checked because the package divent is not attached.
#> → Add `CheckArguments=FALSE` to suppress this warning or run `library('divent')`.
#> ! Function arguments cannot be checked because the package divent is not attached.
#> → Add `CheckArguments=FALSE` to suppress this warning or run `library('divent')`.
#> ! Function arguments cannot be checked because the package divent is not attached.
#> → Add `CheckArguments=FALSE` to suppress this warning or run `library('divent')`.
#> ! Function arguments cannot be checked because the package divent is not attached.
#> → Add `CheckArguments=FALSE` to suppress this warning or run `library('divent')`.
#> ! Function arguments cannot be checked because the package divent is not attached.
#> → Add `CheckArguments=FALSE` to suppress this warning or run `library('divent')`.
#> ! Function arguments cannot be checked because the package divent is not attached.
#> → Add `CheckArguments=FALSE` to suppress this warning or run `library('divent')`.
#> ! Function arguments cannot be checked because the package divent is not attached.
#> → Add `CheckArguments=FALSE` to suppress this warning or run `library('divent')`.
#> ! Function arguments cannot be checked because the package divent is not attached.
#> → Add `CheckArguments=FALSE` to suppress this warning or run `library('divent')`.
#> ! Function arguments cannot be checked because the package divent is not attached.
#> → Add `CheckArguments=FALSE` to suppress this warning or run `library('divent')`.
#> ! Function arguments cannot be checked because the package divent is not attached.
#> → Add `CheckArguments=FALSE` to suppress this warning or run `library('divent')`.
#> ! Function arguments cannot be checked because the package divent is not attached.
#> → Add `CheckArguments=FALSE` to suppress this warning or run `library('divent')`.
#> ! Function arguments cannot be checked because the package divent is not attached.
#> → Add `CheckArguments=FALSE` to suppress this warning or run `library('divent')`.
#> ! Function arguments cannot be checked because the package divent is not attached.
#> → Add `CheckArguments=FALSE` to suppress this warning or run `library('divent')`.
#> ! Function arguments cannot be checked because the package divent is not attached.
#> → Add `CheckArguments=FALSE` to suppress this warning or run `library('divent')`.
#> ! Function arguments cannot be checked because the package divent is not attached.
#> → Add `CheckArguments=FALSE` to suppress this warning or run `library('divent')`.
#> ! Function arguments cannot be checked because the package divent is not attached.
#> → Add `CheckArguments=FALSE` to suppress this warning or run `library('divent')`.
#> ! Function arguments cannot be checked because the package divent is not attached.
#> → Add `CheckArguments=FALSE` to suppress this warning or run `library('divent')`.
#> ! Function arguments cannot be checked because the package divent is not attached.
#> → Add `CheckArguments=FALSE` to suppress this warning or run `library('divent')`.
#> ! Function arguments cannot be checked because the package divent is not attached.
#> → Add `CheckArguments=FALSE` to suppress this warning or run `library('divent')`.
#> ! Function arguments cannot be checked because the package divent is not attached.
#> → Add `CheckArguments=FALSE` to suppress this warning or run `library('divent')`.
#> ! Function arguments cannot be checked because the package divent is not attached.
#> → Add `CheckArguments=FALSE` to suppress this warning or run `library('divent')`.
#> ! Function arguments cannot be checked because the package divent is not attached.
#> → Add `CheckArguments=FALSE` to suppress this warning or run `library('divent')`.
#> ! Function arguments cannot be checked because the package divent is not attached.
#> → Add `CheckArguments=FALSE` to suppress this warning or run `library('divent')`.
#> ! Function arguments cannot be checked because the package divent is not attached.
#> → Add `CheckArguments=FALSE` to suppress this warning or run `library('divent')`.
#> ! Function arguments cannot be checked because the package divent is not attached.
#> → Add `CheckArguments=FALSE` to suppress this warning or run `library('divent')`.
#> ! Function arguments cannot be checked because the package divent is not attached.
#> → Add `CheckArguments=FALSE` to suppress this warning or run `library('divent')`.
#> ! Function arguments cannot be checked because the package divent is not attached.
#> → Add `CheckArguments=FALSE` to suppress this warning or run `library('divent')`.
#> ! Function arguments cannot be checked because the package divent is not attached.
#> → Add `CheckArguments=FALSE` to suppress this warning or run `library('divent')`.
#> ! Function arguments cannot be checked because the package divent is not attached.
#> → Add `CheckArguments=FALSE` to suppress this warning or run `library('divent')`.
#> ! Function arguments cannot be checked because the package divent is not attached.
#> → Add `CheckArguments=FALSE` to suppress this warning or run `library('divent')`.
#> ! Function arguments cannot be checked because the package divent is not attached.
#> → Add `CheckArguments=FALSE` to suppress this warning or run `library('divent')`.
#> ! Function arguments cannot be checked because the package divent is not attached.
#> → Add `CheckArguments=FALSE` to suppress this warning or run `library('divent')`.
#> ! Function arguments cannot be checked because the package divent is not attached.
#> → Add `CheckArguments=FALSE` to suppress this warning or run `library('divent')`.
#> ! Function arguments cannot be checked because the package divent is not attached.
#> → Add `CheckArguments=FALSE` to suppress this warning or run `library('divent')`.
#> ! Function arguments cannot be checked because the package divent is not attached.
#> → Add `CheckArguments=FALSE` to suppress this warning or run `library('divent')`.
#> ! Function arguments cannot be checked because the package divent is not attached.
#> → Add `CheckArguments=FALSE` to suppress this warning or run `library('divent')`.
#> ! Function arguments cannot be checked because the package divent is not attached.
#> → Add `CheckArguments=FALSE` to suppress this warning or run `library('divent')`.
#> ! Function arguments cannot be checked because the package divent is not attached.
#> → Add `CheckArguments=FALSE` to suppress this warning or run `library('divent')`.
#> ! Function arguments cannot be checked because the package divent is not attached.
#> → Add `CheckArguments=FALSE` to suppress this warning or run `library('divent')`.
#> ! Function arguments cannot be checked because the package divent is not attached.
#> → Add `CheckArguments=FALSE` to suppress this warning or run `library('divent')`.
#> ! Function arguments cannot be checked because the package divent is not attached.
#> → Add `CheckArguments=FALSE` to suppress this warning or run `library('divent')`.
#> ! Function arguments cannot be checked because the package divent is not attached.
#> → Add `CheckArguments=FALSE` to suppress this warning or run `library('divent')`.
#> ! Function arguments cannot be checked because the package divent is not attached.
#> → Add `CheckArguments=FALSE` to suppress this warning or run `library('divent')`.
#> ! Function arguments cannot be checked because the package divent is not attached.
#> → Add `CheckArguments=FALSE` to suppress this warning or run `library('divent')`.
#> ! Function arguments cannot be checked because the package divent is not attached.
#> → Add `CheckArguments=FALSE` to suppress this warning or run `library('divent')`.
#> ! Function arguments cannot be checked because the package divent is not attached.
#> → Add `CheckArguments=FALSE` to suppress this warning or run `library('divent')`.
#> ! Function arguments cannot be checked because the package divent is not attached.
#> → Add `CheckArguments=FALSE` to suppress this warning or run `library('divent')`.
#> ! Function arguments cannot be checked because the package divent is not attached.
#> → Add `CheckArguments=FALSE` to suppress this warning or run `library('divent')`.
#> ! Function arguments cannot be checked because the package divent is not attached.
#> → Add `CheckArguments=FALSE` to suppress this warning or run `library('divent')`.
#> ! Function arguments cannot be checked because the package divent is not attached.
#> → Add `CheckArguments=FALSE` to suppress this warning or run `library('divent')`.
#> ! Function arguments cannot be checked because the package divent is not attached.
#> → Add `CheckArguments=FALSE` to suppress this warning or run `library('divent')`.
#> ! Function arguments cannot be checked because the package divent is not attached.
#> → Add `CheckArguments=FALSE` to suppress this warning or run `library('divent')`.
#> ! Function arguments cannot be checked because the package divent is not attached.
#> → Add `CheckArguments=FALSE` to suppress this warning or run `library('divent')`.
#> ! Function arguments cannot be checked because the package divent is not attached.
#> → Add `CheckArguments=FALSE` to suppress this warning or run `library('divent')`.
#> ! Function arguments cannot be checked because the package divent is not attached.
#> → Add `CheckArguments=FALSE` to suppress this warning or run `library('divent')`.
#> ! Function arguments cannot be checked because the package divent is not attached.
#> → Add `CheckArguments=FALSE` to suppress this warning or run `library('divent')`.
#> ! Function arguments cannot be checked because the package divent is not attached.
#> → Add `CheckArguments=FALSE` to suppress this warning or run `library('divent')`.
#> ! Function arguments cannot be checked because the package divent is not attached.
#> → Add `CheckArguments=FALSE` to suppress this warning or run `library('divent')`.
#> ! Function arguments cannot be checked because the package divent is not attached.
#> → Add `CheckArguments=FALSE` to suppress this warning or run `library('divent')`.
#> ! Function arguments cannot be checked because the package divent is not attached.
#> → Add `CheckArguments=FALSE` to suppress this warning or run `library('divent')`.
#> ! Function arguments cannot be checked because the package divent is not attached.
#> → Add `CheckArguments=FALSE` to suppress this warning or run `library('divent')`.
#> ! Function arguments cannot be checked because the package divent is not attached.
#> → Add `CheckArguments=FALSE` to suppress this warning or run `library('divent')`.
#> ! Function arguments cannot be checked because the package divent is not attached.
#> → Add `CheckArguments=FALSE` to suppress this warning or run `library('divent')`.
#> ! Function arguments cannot be checked because the package divent is not attached.
#> → Add `CheckArguments=FALSE` to suppress this warning or run `library('divent')`.
#> ! Function arguments cannot be checked because the package divent is not attached.
#> → Add `CheckArguments=FALSE` to suppress this warning or run `library('divent')`.
#> ! Function arguments cannot be checked because the package divent is not attached.
#> → Add `CheckArguments=FALSE` to suppress this warning or run `library('divent')`.
#> ! Function arguments cannot be checked because the package divent is not attached.
#> → Add `CheckArguments=FALSE` to suppress this warning or run `library('divent')`.
#> ! Function arguments cannot be checked because the package divent is not attached.
#> → Add `CheckArguments=FALSE` to suppress this warning or run `library('divent')`.
#> ! Function arguments cannot be checked because the package divent is not attached.
#> → Add `CheckArguments=FALSE` to suppress this warning or run `library('divent')`.
#> ! Function arguments cannot be checked because the package divent is not attached.
#> → Add `CheckArguments=FALSE` to suppress this warning or run `library('divent')`.
#> ! Function arguments cannot be checked because the package divent is not attached.
#> → Add `CheckArguments=FALSE` to suppress this warning or run `library('divent')`.
#> ! Function arguments cannot be checked because the package divent is not attached.
#> → Add `CheckArguments=FALSE` to suppress this warning or run `library('divent')`.
#> ! Function arguments cannot be checked because the package divent is not attached.
#> → Add `CheckArguments=FALSE` to suppress this warning or run `library('divent')`.
#> ! Function arguments cannot be checked because the package divent is not attached.
#> → Add `CheckArguments=FALSE` to suppress this warning or run `library('divent')`.
#> ! Function arguments cannot be checked because the package divent is not attached.
#> → Add `CheckArguments=FALSE` to suppress this warning or run `library('divent')`.
#> ! Function arguments cannot be checked because the package divent is not attached.
#> → Add `CheckArguments=FALSE` to suppress this warning or run `library('divent')`.
#> ! Function arguments cannot be checked because the package divent is not attached.
#> → Add `CheckArguments=FALSE` to suppress this warning or run `library('divent')`.
#> ! Function arguments cannot be checked because the package divent is not attached.
#> → Add `CheckArguments=FALSE` to suppress this warning or run `library('divent')`.
#> ! Function arguments cannot be checked because the package divent is not attached.
#> → Add `CheckArguments=FALSE` to suppress this warning or run `library('divent')`.
#> ! Function arguments cannot be checked because the package divent is not attached.
#> → Add `CheckArguments=FALSE` to suppress this warning or run `library('divent')`.
#> ! Function arguments cannot be checked because the package divent is not attached.
#> → Add `CheckArguments=FALSE` to suppress this warning or run `library('divent')`.
#> ! Function arguments cannot be checked because the package divent is not attached.
#> → Add `CheckArguments=FALSE` to suppress this warning or run `library('divent')`.
#> ! Function arguments cannot be checked because the package divent is not attached.
#> → Add `CheckArguments=FALSE` to suppress this warning or run `library('divent')`.
#> ! Function arguments cannot be checked because the package divent is not attached.
#> → Add `CheckArguments=FALSE` to suppress this warning or run `library('divent')`.
#> ! Function arguments cannot be checked because the package divent is not attached.
#> → Add `CheckArguments=FALSE` to suppress this warning or run `library('divent')`.
#> ! Function arguments cannot be checked because the package divent is not attached.
#> → Add `CheckArguments=FALSE` to suppress this warning or run `library('divent')`.
#> ! Function arguments cannot be checked because the package divent is not attached.
#> → Add `CheckArguments=FALSE` to suppress this warning or run `library('divent')`.
#> ! Function arguments cannot be checked because the package divent is not attached.
#> → Add `CheckArguments=FALSE` to suppress this warning or run `library('divent')`.
#> ! Function arguments cannot be checked because the package divent is not attached.
#> → Add `CheckArguments=FALSE` to suppress this warning or run `library('divent')`.
#> ! Function arguments cannot be checked because the package divent is not attached.
#> → Add `CheckArguments=FALSE` to suppress this warning or run `library('divent')`.
#> ! Function arguments cannot be checked because the package divent is not attached.
#> → Add `CheckArguments=FALSE` to suppress this warning or run `library('divent')`.
#> ! Function arguments cannot be checked because the package divent is not attached.
#> → Add `CheckArguments=FALSE` to suppress this warning or run `library('divent')`.
#> ! Function arguments cannot be checked because the package divent is not attached.
#> → Add `CheckArguments=FALSE` to suppress this warning or run `library('divent')`.
#> ! Function arguments cannot be checked because the package divent is not attached.
#> → Add `CheckArguments=FALSE` to suppress this warning or run `library('divent')`.
#> ! Function arguments cannot be checked because the package divent is not attached.
#> → Add `CheckArguments=FALSE` to suppress this warning or run `library('divent')`.
#> ! Function arguments cannot be checked because the package divent is not attached.
#> → Add `CheckArguments=FALSE` to suppress this warning or run `library('divent')`.
#> ! Function arguments cannot be checked because the package divent is not attached.
#> → Add `CheckArguments=FALSE` to suppress this warning or run `library('divent')`.
#> ! Function arguments cannot be checked because the package divent is not attached.
#> → Add `CheckArguments=FALSE` to suppress this warning or run `library('divent')`.
#> ! Function arguments cannot be checked because the package divent is not attached.
#> → Add `CheckArguments=FALSE` to suppress this warning or run `library('divent')`.
#> ! Function arguments cannot be checked because the package divent is not attached.
#> → Add `CheckArguments=FALSE` to suppress this warning or run `library('divent')`.
#> ! Function arguments cannot be checked because the package divent is not attached.
#> → Add `CheckArguments=FALSE` to suppress this warning or run `library('divent')`.
#> ! Function arguments cannot be checked because the package divent is not attached.
#> → Add `CheckArguments=FALSE` to suppress this warning or run `library('divent')`.
#> ! Function arguments cannot be checked because the package divent is not attached.
#> → Add `CheckArguments=FALSE` to suppress this warning or run `library('divent')`.
#> ! Function arguments cannot be checked because the package divent is not attached.
#> → Add `CheckArguments=FALSE` to suppress this warning or run `library('divent')`.
#> ! Function arguments cannot be checked because the package divent is not attached.
#> → Add `CheckArguments=FALSE` to suppress this warning or run `library('divent')`.
#> ! Function arguments cannot be checked because the package divent is not attached.
#> → Add `CheckArguments=FALSE` to suppress this warning or run `library('divent')`.
#> ! Function arguments cannot be checked because the package divent is not attached.
#> → Add `CheckArguments=FALSE` to suppress this warning or run `library('divent')`.
#> ! Function arguments cannot be checked because the package divent is not attached.
#> → Add `CheckArguments=FALSE` to suppress this warning or run `library('divent')`.
#> ! Function arguments cannot be checked because the package divent is not attached.
#> → Add `CheckArguments=FALSE` to suppress this warning or run `library('divent')`.
#> ! Function arguments cannot be checked because the package divent is not attached.
#> → Add `CheckArguments=FALSE` to suppress this warning or run `library('divent')`.
#> ! Function arguments cannot be checked because the package divent is not attached.
#> → Add `CheckArguments=FALSE` to suppress this warning or run `library('divent')`.
#> ! Function arguments cannot be checked because the package divent is not attached.
#> → Add `CheckArguments=FALSE` to suppress this warning or run `library('divent')`.
#> ! Function arguments cannot be checked because the package divent is not attached.
#> → Add `CheckArguments=FALSE` to suppress this warning or run `library('divent')`.
#> ! Function arguments cannot be checked because the package divent is not attached.
#> → Add `CheckArguments=FALSE` to suppress this warning or run `library('divent')`.
#> ! Function arguments cannot be checked because the package divent is not attached.
#> → Add `CheckArguments=FALSE` to suppress this warning or run `library('divent')`.
#> ! Function arguments cannot be checked because the package divent is not attached.
#> → Add `CheckArguments=FALSE` to suppress this warning or run `library('divent')`.
#> ! Function arguments cannot be checked because the package divent is not attached.
#> → Add `CheckArguments=FALSE` to suppress this warning or run `library('divent')`.
#> ! Function arguments cannot be checked because the package divent is not attached.
#> → Add `CheckArguments=FALSE` to suppress this warning or run `library('divent')`.
#> ! Function arguments cannot be checked because the package divent is not attached.
#> → Add `CheckArguments=FALSE` to suppress this warning or run `library('divent')`.
#> ! Function arguments cannot be checked because the package divent is not attached.
#> → Add `CheckArguments=FALSE` to suppress this warning or run `library('divent')`.
#> ! Function arguments cannot be checked because the package divent is not attached.
#> → Add `CheckArguments=FALSE` to suppress this warning or run `library('divent')`.
#> ! Function arguments cannot be checked because the package divent is not attached.
#> → Add `CheckArguments=FALSE` to suppress this warning or run `library('divent')`.
#> ! Function arguments cannot be checked because the package divent is not attached.
#> → Add `CheckArguments=FALSE` to suppress this warning or run `library('divent')`.
#> ! Function arguments cannot be checked because the package divent is not attached.
#> → Add `CheckArguments=FALSE` to suppress this warning or run `library('divent')`.
#> ! Function arguments cannot be checked because the package divent is not attached.
#> → Add `CheckArguments=FALSE` to suppress this warning or run `library('divent')`.
#> ! Function arguments cannot be checked because the package divent is not attached.
#> → Add `CheckArguments=FALSE` to suppress this warning or run `library('divent')`.
#> ! Function arguments cannot be checked because the package divent is not attached.
#> → Add `CheckArguments=FALSE` to suppress this warning or run `library('divent')`.
#> ! Function arguments cannot be checked because the package divent is not attached.
#> → Add `CheckArguments=FALSE` to suppress this warning or run `library('divent')`.
#> ! Function arguments cannot be checked because the package divent is not attached.
#> → Add `CheckArguments=FALSE` to suppress this warning or run `library('divent')`.
#> ! Function arguments cannot be checked because the package divent is not attached.
#> → Add `CheckArguments=FALSE` to suppress this warning or run `library('divent')`.
#> ! Function arguments cannot be checked because the package divent is not attached.
#> → Add `CheckArguments=FALSE` to suppress this warning or run `library('divent')`.
#> ! Function arguments cannot be checked because the package divent is not attached.
#> → Add `CheckArguments=FALSE` to suppress this warning or run `library('divent')`.
#> ! Function arguments cannot be checked because the package divent is not attached.
#> → Add `CheckArguments=FALSE` to suppress this warning or run `library('divent')`.
#> ! Function arguments cannot be checked because the package divent is not attached.
#> → Add `CheckArguments=FALSE` to suppress this warning or run `library('divent')`.
#> ! Function arguments cannot be checked because the package divent is not attached.
#> → Add `CheckArguments=FALSE` to suppress this warning or run `library('divent')`.
#> ! Function arguments cannot be checked because the package divent is not attached.
#> → Add `CheckArguments=FALSE` to suppress this warning or run `library('divent')`.
#> ! Function arguments cannot be checked because the package divent is not attached.
#> → Add `CheckArguments=FALSE` to suppress this warning or run `library('divent')`.
#> Warning: Removed 2 rows containing missing values or values outside the scale range
#> (`geom_boot_ci()`).
#> Warning: Removed 2 rows containing missing values or values outside the scale range
#> (`geom_boot_ci()`).
#> Warning: Removed 2 rows containing missing values or values outside the scale range
#> (`geom_boot_ci()`).
#> → Processing: fungi_with_less_otu_in_High
#> ! Function arguments cannot be checked because the package divent is not attached.
#> → Add `CheckArguments=FALSE` to suppress this warning or run `library('divent')`.
#> ! Function arguments cannot be checked because the package divent is not attached.
#> → Add `CheckArguments=FALSE` to suppress this warning or run `library('divent')`.
#> ! Function arguments cannot be checked because the package divent is not attached.
#> → Add `CheckArguments=FALSE` to suppress this warning or run `library('divent')`.
#> ! Function arguments cannot be checked because the package divent is not attached.
#> → Add `CheckArguments=FALSE` to suppress this warning or run `library('divent')`.
#> ! Function arguments cannot be checked because the package divent is not attached.
#> → Add `CheckArguments=FALSE` to suppress this warning or run `library('divent')`.
#> ! Function arguments cannot be checked because the package divent is not attached.
#> → Add `CheckArguments=FALSE` to suppress this warning or run `library('divent')`.
#> ! Function arguments cannot be checked because the package divent is not attached.
#> → Add `CheckArguments=FALSE` to suppress this warning or run `library('divent')`.
#> ! Function arguments cannot be checked because the package divent is not attached.
#> → Add `CheckArguments=FALSE` to suppress this warning or run `library('divent')`.
#> ! Function arguments cannot be checked because the package divent is not attached.
#> → Add `CheckArguments=FALSE` to suppress this warning or run `library('divent')`.
#> ! Function arguments cannot be checked because the package divent is not attached.
#> → Add `CheckArguments=FALSE` to suppress this warning or run `library('divent')`.
#> ! Function arguments cannot be checked because the package divent is not attached.
#> → Add `CheckArguments=FALSE` to suppress this warning or run `library('divent')`.
#> ! Function arguments cannot be checked because the package divent is not attached.
#> → Add `CheckArguments=FALSE` to suppress this warning or run `library('divent')`.
#> ! Function arguments cannot be checked because the package divent is not attached.
#> → Add `CheckArguments=FALSE` to suppress this warning or run `library('divent')`.
#> ! Function arguments cannot be checked because the package divent is not attached.
#> → Add `CheckArguments=FALSE` to suppress this warning or run `library('divent')`.
#> ! Function arguments cannot be checked because the package divent is not attached.
#> → Add `CheckArguments=FALSE` to suppress this warning or run `library('divent')`.
#> ! Function arguments cannot be checked because the package divent is not attached.
#> → Add `CheckArguments=FALSE` to suppress this warning or run `library('divent')`.
#> ! Function arguments cannot be checked because the package divent is not attached.
#> → Add `CheckArguments=FALSE` to suppress this warning or run `library('divent')`.
#> ! Function arguments cannot be checked because the package divent is not attached.
#> → Add `CheckArguments=FALSE` to suppress this warning or run `library('divent')`.
#> ! Function arguments cannot be checked because the package divent is not attached.
#> → Add `CheckArguments=FALSE` to suppress this warning or run `library('divent')`.
#> ! Function arguments cannot be checked because the package divent is not attached.
#> → Add `CheckArguments=FALSE` to suppress this warning or run `library('divent')`.
#> ! Function arguments cannot be checked because the package divent is not attached.
#> → Add `CheckArguments=FALSE` to suppress this warning or run `library('divent')`.
#> ! Function arguments cannot be checked because the package divent is not attached.
#> → Add `CheckArguments=FALSE` to suppress this warning or run `library('divent')`.
#> ! Function arguments cannot be checked because the package divent is not attached.
#> → Add `CheckArguments=FALSE` to suppress this warning or run `library('divent')`.
#> ! Function arguments cannot be checked because the package divent is not attached.
#> → Add `CheckArguments=FALSE` to suppress this warning or run `library('divent')`.
#> ! Function arguments cannot be checked because the package divent is not attached.
#> → Add `CheckArguments=FALSE` to suppress this warning or run `library('divent')`.
#> ! Function arguments cannot be checked because the package divent is not attached.
#> → Add `CheckArguments=FALSE` to suppress this warning or run `library('divent')`.
#> ! Function arguments cannot be checked because the package divent is not attached.
#> → Add `CheckArguments=FALSE` to suppress this warning or run `library('divent')`.
#> ! Function arguments cannot be checked because the package divent is not attached.
#> → Add `CheckArguments=FALSE` to suppress this warning or run `library('divent')`.
#> ! Function arguments cannot be checked because the package divent is not attached.
#> → Add `CheckArguments=FALSE` to suppress this warning or run `library('divent')`.
#> ! Function arguments cannot be checked because the package divent is not attached.
#> → Add `CheckArguments=FALSE` to suppress this warning or run `library('divent')`.
#> ! Function arguments cannot be checked because the package divent is not attached.
#> → Add `CheckArguments=FALSE` to suppress this warning or run `library('divent')`.
#> ! Function arguments cannot be checked because the package divent is not attached.
#> → Add `CheckArguments=FALSE` to suppress this warning or run `library('divent')`.
#> ! Function arguments cannot be checked because the package divent is not attached.
#> → Add `CheckArguments=FALSE` to suppress this warning or run `library('divent')`.
#> ! Function arguments cannot be checked because the package divent is not attached.
#> → Add `CheckArguments=FALSE` to suppress this warning or run `library('divent')`.
#> ! Function arguments cannot be checked because the package divent is not attached.
#> → Add `CheckArguments=FALSE` to suppress this warning or run `library('divent')`.
#> ! Function arguments cannot be checked because the package divent is not attached.
#> → Add `CheckArguments=FALSE` to suppress this warning or run `library('divent')`.
#> ! Function arguments cannot be checked because the package divent is not attached.
#> → Add `CheckArguments=FALSE` to suppress this warning or run `library('divent')`.
#> ! Function arguments cannot be checked because the package divent is not attached.
#> → Add `CheckArguments=FALSE` to suppress this warning or run `library('divent')`.
#> ! Function arguments cannot be checked because the package divent is not attached.
#> → Add `CheckArguments=FALSE` to suppress this warning or run `library('divent')`.
#> ! Function arguments cannot be checked because the package divent is not attached.
#> → Add `CheckArguments=FALSE` to suppress this warning or run `library('divent')`.
#> ! Function arguments cannot be checked because the package divent is not attached.
#> → Add `CheckArguments=FALSE` to suppress this warning or run `library('divent')`.
#> ! Function arguments cannot be checked because the package divent is not attached.
#> → Add `CheckArguments=FALSE` to suppress this warning or run `library('divent')`.
#> ! Function arguments cannot be checked because the package divent is not attached.
#> → Add `CheckArguments=FALSE` to suppress this warning or run `library('divent')`.
#> ! Function arguments cannot be checked because the package divent is not attached.
#> → Add `CheckArguments=FALSE` to suppress this warning or run `library('divent')`.
#> ! Function arguments cannot be checked because the package divent is not attached.
#> → Add `CheckArguments=FALSE` to suppress this warning or run `library('divent')`.
#> ! Function arguments cannot be checked because the package divent is not attached.
#> → Add `CheckArguments=FALSE` to suppress this warning or run `library('divent')`.
#> ! Function arguments cannot be checked because the package divent is not attached.
#> → Add `CheckArguments=FALSE` to suppress this warning or run `library('divent')`.
#> ! Function arguments cannot be checked because the package divent is not attached.
#> → Add `CheckArguments=FALSE` to suppress this warning or run `library('divent')`.
#> ! Function arguments cannot be checked because the package divent is not attached.
#> → Add `CheckArguments=FALSE` to suppress this warning or run `library('divent')`.
#> ! Function arguments cannot be checked because the package divent is not attached.
#> → Add `CheckArguments=FALSE` to suppress this warning or run `library('divent')`.
#> ! Function arguments cannot be checked because the package divent is not attached.
#> → Add `CheckArguments=FALSE` to suppress this warning or run `library('divent')`.
#> ! Function arguments cannot be checked because the package divent is not attached.
#> → Add `CheckArguments=FALSE` to suppress this warning or run `library('divent')`.
#> ! Function arguments cannot be checked because the package divent is not attached.
#> → Add `CheckArguments=FALSE` to suppress this warning or run `library('divent')`.
#> ! Function arguments cannot be checked because the package divent is not attached.
#> → Add `CheckArguments=FALSE` to suppress this warning or run `library('divent')`.
#> ! Function arguments cannot be checked because the package divent is not attached.
#> → Add `CheckArguments=FALSE` to suppress this warning or run `library('divent')`.
#> ! Function arguments cannot be checked because the package divent is not attached.
#> → Add `CheckArguments=FALSE` to suppress this warning or run `library('divent')`.
#> ! Function arguments cannot be checked because the package divent is not attached.
#> → Add `CheckArguments=FALSE` to suppress this warning or run `library('divent')`.
#> ! Function arguments cannot be checked because the package divent is not attached.
#> → Add `CheckArguments=FALSE` to suppress this warning or run `library('divent')`.
#> ! Function arguments cannot be checked because the package divent is not attached.
#> → Add `CheckArguments=FALSE` to suppress this warning or run `library('divent')`.
#> ! Function arguments cannot be checked because the package divent is not attached.
#> → Add `CheckArguments=FALSE` to suppress this warning or run `library('divent')`.
#> ! Function arguments cannot be checked because the package divent is not attached.
#> → Add `CheckArguments=FALSE` to suppress this warning or run `library('divent')`.
#> ! Function arguments cannot be checked because the package divent is not attached.
#> → Add `CheckArguments=FALSE` to suppress this warning or run `library('divent')`.
#> ! Function arguments cannot be checked because the package divent is not attached.
#> → Add `CheckArguments=FALSE` to suppress this warning or run `library('divent')`.
#> ! Function arguments cannot be checked because the package divent is not attached.
#> → Add `CheckArguments=FALSE` to suppress this warning or run `library('divent')`.
#> ! Function arguments cannot be checked because the package divent is not attached.
#> → Add `CheckArguments=FALSE` to suppress this warning or run `library('divent')`.
#> ! Function arguments cannot be checked because the package divent is not attached.
#> → Add `CheckArguments=FALSE` to suppress this warning or run `library('divent')`.
#> ! Function arguments cannot be checked because the package divent is not attached.
#> → Add `CheckArguments=FALSE` to suppress this warning or run `library('divent')`.
#> ! Function arguments cannot be checked because the package divent is not attached.
#> → Add `CheckArguments=FALSE` to suppress this warning or run `library('divent')`.
#> ! Function arguments cannot be checked because the package divent is not attached.
#> → Add `CheckArguments=FALSE` to suppress this warning or run `library('divent')`.
#> ! Function arguments cannot be checked because the package divent is not attached.
#> → Add `CheckArguments=FALSE` to suppress this warning or run `library('divent')`.
#> ! Function arguments cannot be checked because the package divent is not attached.
#> → Add `CheckArguments=FALSE` to suppress this warning or run `library('divent')`.
#> ! Function arguments cannot be checked because the package divent is not attached.
#> → Add `CheckArguments=FALSE` to suppress this warning or run `library('divent')`.
#> ! Function arguments cannot be checked because the package divent is not attached.
#> → Add `CheckArguments=FALSE` to suppress this warning or run `library('divent')`.
#> ! Function arguments cannot be checked because the package divent is not attached.
#> → Add `CheckArguments=FALSE` to suppress this warning or run `library('divent')`.
#> ! Function arguments cannot be checked because the package divent is not attached.
#> → Add `CheckArguments=FALSE` to suppress this warning or run `library('divent')`.
#> ! Function arguments cannot be checked because the package divent is not attached.
#> → Add `CheckArguments=FALSE` to suppress this warning or run `library('divent')`.
#> ! Function arguments cannot be checked because the package divent is not attached.
#> → Add `CheckArguments=FALSE` to suppress this warning or run `library('divent')`.
#> ! Function arguments cannot be checked because the package divent is not attached.
#> → Add `CheckArguments=FALSE` to suppress this warning or run `library('divent')`.
#> ! Function arguments cannot be checked because the package divent is not attached.
#> → Add `CheckArguments=FALSE` to suppress this warning or run `library('divent')`.
#> ! Function arguments cannot be checked because the package divent is not attached.
#> → Add `CheckArguments=FALSE` to suppress this warning or run `library('divent')`.
#> ! Function arguments cannot be checked because the package divent is not attached.
#> → Add `CheckArguments=FALSE` to suppress this warning or run `library('divent')`.
#> ! Function arguments cannot be checked because the package divent is not attached.
#> → Add `CheckArguments=FALSE` to suppress this warning or run `library('divent')`.
#> ! Function arguments cannot be checked because the package divent is not attached.
#> → Add `CheckArguments=FALSE` to suppress this warning or run `library('divent')`.
#> ! Function arguments cannot be checked because the package divent is not attached.
#> → Add `CheckArguments=FALSE` to suppress this warning or run `library('divent')`.
#> ! Function arguments cannot be checked because the package divent is not attached.
#> → Add `CheckArguments=FALSE` to suppress this warning or run `library('divent')`.
#> ! Function arguments cannot be checked because the package divent is not attached.
#> → Add `CheckArguments=FALSE` to suppress this warning or run `library('divent')`.
#> ! Function arguments cannot be checked because the package divent is not attached.
#> → Add `CheckArguments=FALSE` to suppress this warning or run `library('divent')`.
#> ! Function arguments cannot be checked because the package divent is not attached.
#> → Add `CheckArguments=FALSE` to suppress this warning or run `library('divent')`.
#> ! Function arguments cannot be checked because the package divent is not attached.
#> → Add `CheckArguments=FALSE` to suppress this warning or run `library('divent')`.
#> ! Function arguments cannot be checked because the package divent is not attached.
#> → Add `CheckArguments=FALSE` to suppress this warning or run `library('divent')`.
#> ! Function arguments cannot be checked because the package divent is not attached.
#> → Add `CheckArguments=FALSE` to suppress this warning or run `library('divent')`.
#> ! Function arguments cannot be checked because the package divent is not attached.
#> → Add `CheckArguments=FALSE` to suppress this warning or run `library('divent')`.
#> ! Function arguments cannot be checked because the package divent is not attached.
#> → Add `CheckArguments=FALSE` to suppress this warning or run `library('divent')`.
#> ! Function arguments cannot be checked because the package divent is not attached.
#> → Add `CheckArguments=FALSE` to suppress this warning or run `library('divent')`.
#> ! Function arguments cannot be checked because the package divent is not attached.
#> → Add `CheckArguments=FALSE` to suppress this warning or run `library('divent')`.
#> ! Function arguments cannot be checked because the package divent is not attached.
#> → Add `CheckArguments=FALSE` to suppress this warning or run `library('divent')`.
#> ! Function arguments cannot be checked because the package divent is not attached.
#> → Add `CheckArguments=FALSE` to suppress this warning or run `library('divent')`.
#> ! Function arguments cannot be checked because the package divent is not attached.
#> → Add `CheckArguments=FALSE` to suppress this warning or run `library('divent')`.
#> ! Function arguments cannot be checked because the package divent is not attached.
#> → Add `CheckArguments=FALSE` to suppress this warning or run `library('divent')`.
#> ! Function arguments cannot be checked because the package divent is not attached.
#> → Add `CheckArguments=FALSE` to suppress this warning or run `library('divent')`.
#> ! Function arguments cannot be checked because the package divent is not attached.
#> → Add `CheckArguments=FALSE` to suppress this warning or run `library('divent')`.
#> ! Function arguments cannot be checked because the package divent is not attached.
#> → Add `CheckArguments=FALSE` to suppress this warning or run `library('divent')`.
#> ! Function arguments cannot be checked because the package divent is not attached.
#> → Add `CheckArguments=FALSE` to suppress this warning or run `library('divent')`.
#> ! Function arguments cannot be checked because the package divent is not attached.
#> → Add `CheckArguments=FALSE` to suppress this warning or run `library('divent')`.
#> ! Function arguments cannot be checked because the package divent is not attached.
#> → Add `CheckArguments=FALSE` to suppress this warning or run `library('divent')`.
#> ! Function arguments cannot be checked because the package divent is not attached.
#> → Add `CheckArguments=FALSE` to suppress this warning or run `library('divent')`.
#> ! Function arguments cannot be checked because the package divent is not attached.
#> → Add `CheckArguments=FALSE` to suppress this warning or run `library('divent')`.
#> ! Function arguments cannot be checked because the package divent is not attached.
#> → Add `CheckArguments=FALSE` to suppress this warning or run `library('divent')`.
#> ! Function arguments cannot be checked because the package divent is not attached.
#> → Add `CheckArguments=FALSE` to suppress this warning or run `library('divent')`.
#> ! Function arguments cannot be checked because the package divent is not attached.
#> → Add `CheckArguments=FALSE` to suppress this warning or run `library('divent')`.
#> ! Function arguments cannot be checked because the package divent is not attached.
#> → Add `CheckArguments=FALSE` to suppress this warning or run `library('divent')`.
#> ! Function arguments cannot be checked because the package divent is not attached.
#> → Add `CheckArguments=FALSE` to suppress this warning or run `library('divent')`.
#> ! Function arguments cannot be checked because the package divent is not attached.
#> → Add `CheckArguments=FALSE` to suppress this warning or run `library('divent')`.
#> ! Function arguments cannot be checked because the package divent is not attached.
#> → Add `CheckArguments=FALSE` to suppress this warning or run `library('divent')`.
#> ! Function arguments cannot be checked because the package divent is not attached.
#> → Add `CheckArguments=FALSE` to suppress this warning or run `library('divent')`.
#> ! Function arguments cannot be checked because the package divent is not attached.
#> → Add `CheckArguments=FALSE` to suppress this warning or run `library('divent')`.
#> ! Function arguments cannot be checked because the package divent is not attached.
#> → Add `CheckArguments=FALSE` to suppress this warning or run `library('divent')`.
#> ! Function arguments cannot be checked because the package divent is not attached.
#> → Add `CheckArguments=FALSE` to suppress this warning or run `library('divent')`.
#> ! Function arguments cannot be checked because the package divent is not attached.
#> → Add `CheckArguments=FALSE` to suppress this warning or run `library('divent')`.
#> ! Function arguments cannot be checked because the package divent is not attached.
#> → Add `CheckArguments=FALSE` to suppress this warning or run `library('divent')`.
#> ! Function arguments cannot be checked because the package divent is not attached.
#> → Add `CheckArguments=FALSE` to suppress this warning or run `library('divent')`.
#> ! Function arguments cannot be checked because the package divent is not attached.
#> → Add `CheckArguments=FALSE` to suppress this warning or run `library('divent')`.
#> ! Function arguments cannot be checked because the package divent is not attached.
#> → Add `CheckArguments=FALSE` to suppress this warning or run `library('divent')`.
#> ! Function arguments cannot be checked because the package divent is not attached.
#> → Add `CheckArguments=FALSE` to suppress this warning or run `library('divent')`.
#> ! Function arguments cannot be checked because the package divent is not attached.
#> → Add `CheckArguments=FALSE` to suppress this warning or run `library('divent')`.
#> ! Function arguments cannot be checked because the package divent is not attached.
#> → Add `CheckArguments=FALSE` to suppress this warning or run `library('divent')`.
#> ! Function arguments cannot be checked because the package divent is not attached.
#> → Add `CheckArguments=FALSE` to suppress this warning or run `library('divent')`.
#> ! Function arguments cannot be checked because the package divent is not attached.
#> → Add `CheckArguments=FALSE` to suppress this warning or run `library('divent')`.
#> ! Function arguments cannot be checked because the package divent is not attached.
#> → Add `CheckArguments=FALSE` to suppress this warning or run `library('divent')`.
#> ! Function arguments cannot be checked because the package divent is not attached.
#> → Add `CheckArguments=FALSE` to suppress this warning or run `library('divent')`.
#> ! Function arguments cannot be checked because the package divent is not attached.
#> → Add `CheckArguments=FALSE` to suppress this warning or run `library('divent')`.
#> ! Function arguments cannot be checked because the package divent is not attached.
#> → Add `CheckArguments=FALSE` to suppress this warning or run `library('divent')`.
#> ! Function arguments cannot be checked because the package divent is not attached.
#> → Add `CheckArguments=FALSE` to suppress this warning or run `library('divent')`.
#> ! Function arguments cannot be checked because the package divent is not attached.
#> → Add `CheckArguments=FALSE` to suppress this warning or run `library('divent')`.
#> ! Function arguments cannot be checked because the package divent is not attached.
#> → Add `CheckArguments=FALSE` to suppress this warning or run `library('divent')`.
#> ! Function arguments cannot be checked because the package divent is not attached.
#> → Add `CheckArguments=FALSE` to suppress this warning or run `library('divent')`.
#> ! Function arguments cannot be checked because the package divent is not attached.
#> → Add `CheckArguments=FALSE` to suppress this warning or run `library('divent')`.
#> ! Function arguments cannot be checked because the package divent is not attached.
#> → Add `CheckArguments=FALSE` to suppress this warning or run `library('divent')`.
#> ! Function arguments cannot be checked because the package divent is not attached.
#> → Add `CheckArguments=FALSE` to suppress this warning or run `library('divent')`.
#> ! Function arguments cannot be checked because the package divent is not attached.
#> → Add `CheckArguments=FALSE` to suppress this warning or run `library('divent')`.
#> ! Function arguments cannot be checked because the package divent is not attached.
#> → Add `CheckArguments=FALSE` to suppress this warning or run `library('divent')`.
#> ! Function arguments cannot be checked because the package divent is not attached.
#> → Add `CheckArguments=FALSE` to suppress this warning or run `library('divent')`.
#> ! Function arguments cannot be checked because the package divent is not attached.
#> → Add `CheckArguments=FALSE` to suppress this warning or run `library('divent')`.
#> ! Function arguments cannot be checked because the package divent is not attached.
#> → Add `CheckArguments=FALSE` to suppress this warning or run `library('divent')`.
#> ! Function arguments cannot be checked because the package divent is not attached.
#> → Add `CheckArguments=FALSE` to suppress this warning or run `library('divent')`.
#> ! Function arguments cannot be checked because the package divent is not attached.
#> → Add `CheckArguments=FALSE` to suppress this warning or run `library('divent')`.
#> ! Function arguments cannot be checked because the package divent is not attached.
#> → Add `CheckArguments=FALSE` to suppress this warning or run `library('divent')`.
#> ! Function arguments cannot be checked because the package divent is not attached.
#> → Add `CheckArguments=FALSE` to suppress this warning or run `library('divent')`.
#> ! Function arguments cannot be checked because the package divent is not attached.
#> → Add `CheckArguments=FALSE` to suppress this warning or run `library('divent')`.
#> ! Function arguments cannot be checked because the package divent is not attached.
#> → Add `CheckArguments=FALSE` to suppress this warning or run `library('divent')`.
#> ! Function arguments cannot be checked because the package divent is not attached.
#> → Add `CheckArguments=FALSE` to suppress this warning or run `library('divent')`.
#> ! Function arguments cannot be checked because the package divent is not attached.
#> → Add `CheckArguments=FALSE` to suppress this warning or run `library('divent')`.
#> ! Function arguments cannot be checked because the package divent is not attached.
#> → Add `CheckArguments=FALSE` to suppress this warning or run `library('divent')`.
#> ! Function arguments cannot be checked because the package divent is not attached.
#> → Add `CheckArguments=FALSE` to suppress this warning or run `library('divent')`.
#> ! Function arguments cannot be checked because the package divent is not attached.
#> → Add `CheckArguments=FALSE` to suppress this warning or run `library('divent')`.
#> ! Function arguments cannot be checked because the package divent is not attached.
#> → Add `CheckArguments=FALSE` to suppress this warning or run `library('divent')`.
#> ! Function arguments cannot be checked because the package divent is not attached.
#> → Add `CheckArguments=FALSE` to suppress this warning or run `library('divent')`.
#> ! Function arguments cannot be checked because the package divent is not attached.
#> → Add `CheckArguments=FALSE` to suppress this warning or run `library('divent')`.
#> ! Function arguments cannot be checked because the package divent is not attached.
#> → Add `CheckArguments=FALSE` to suppress this warning or run `library('divent')`.
#> ! Function arguments cannot be checked because the package divent is not attached.
#> → Add `CheckArguments=FALSE` to suppress this warning or run `library('divent')`.
#> ! Function arguments cannot be checked because the package divent is not attached.
#> → Add `CheckArguments=FALSE` to suppress this warning or run `library('divent')`.
#> ! Function arguments cannot be checked because the package divent is not attached.
#> → Add `CheckArguments=FALSE` to suppress this warning or run `library('divent')`.
#> ! Function arguments cannot be checked because the package divent is not attached.
#> → Add `CheckArguments=FALSE` to suppress this warning or run `library('divent')`.
#> ! Function arguments cannot be checked because the package divent is not attached.
#> → Add `CheckArguments=FALSE` to suppress this warning or run `library('divent')`.
#> ! Function arguments cannot be checked because the package divent is not attached.
#> → Add `CheckArguments=FALSE` to suppress this warning or run `library('divent')`.
#> ! Function arguments cannot be checked because the package divent is not attached.
#> → Add `CheckArguments=FALSE` to suppress this warning or run `library('divent')`.
#> ! Function arguments cannot be checked because the package divent is not attached.
#> → Add `CheckArguments=FALSE` to suppress this warning or run `library('divent')`.
#> ! Function arguments cannot be checked because the package divent is not attached.
#> → Add `CheckArguments=FALSE` to suppress this warning or run `library('divent')`.
#> ! Function arguments cannot be checked because the package divent is not attached.
#> → Add `CheckArguments=FALSE` to suppress this warning or run `library('divent')`.
#> ! Function arguments cannot be checked because the package divent is not attached.
#> → Add `CheckArguments=FALSE` to suppress this warning or run `library('divent')`.
#> ! Function arguments cannot be checked because the package divent is not attached.
#> → Add `CheckArguments=FALSE` to suppress this warning or run `library('divent')`.
#> ! Function arguments cannot be checked because the package divent is not attached.
#> → Add `CheckArguments=FALSE` to suppress this warning or run `library('divent')`.
#> ! Function arguments cannot be checked because the package divent is not attached.
#> → Add `CheckArguments=FALSE` to suppress this warning or run `library('divent')`.
#> ! Function arguments cannot be checked because the package divent is not attached.
#> → Add `CheckArguments=FALSE` to suppress this warning or run `library('divent')`.
#> ! Function arguments cannot be checked because the package divent is not attached.
#> → Add `CheckArguments=FALSE` to suppress this warning or run `library('divent')`.
#> ! Function arguments cannot be checked because the package divent is not attached.
#> → Add `CheckArguments=FALSE` to suppress this warning or run `library('divent')`.
#> ! Function arguments cannot be checked because the package divent is not attached.
#> → Add `CheckArguments=FALSE` to suppress this warning or run `library('divent')`.
#> ! Function arguments cannot be checked because the package divent is not attached.
#> → Add `CheckArguments=FALSE` to suppress this warning or run `library('divent')`.
#> ! Function arguments cannot be checked because the package divent is not attached.
#> → Add `CheckArguments=FALSE` to suppress this warning or run `library('divent')`.
#> ! Function arguments cannot be checked because the package divent is not attached.
#> → Add `CheckArguments=FALSE` to suppress this warning or run `library('divent')`.
#> ! Function arguments cannot be checked because the package divent is not attached.
#> → Add `CheckArguments=FALSE` to suppress this warning or run `library('divent')`.
#> ! Function arguments cannot be checked because the package divent is not attached.
#> → Add `CheckArguments=FALSE` to suppress this warning or run `library('divent')`.
#> ! Function arguments cannot be checked because the package divent is not attached.
#> → Add `CheckArguments=FALSE` to suppress this warning or run `library('divent')`.
#> ! Function arguments cannot be checked because the package divent is not attached.
#> → Add `CheckArguments=FALSE` to suppress this warning or run `library('divent')`.
#> ! Function arguments cannot be checked because the package divent is not attached.
#> → Add `CheckArguments=FALSE` to suppress this warning or run `library('divent')`.
#> ! Function arguments cannot be checked because the package divent is not attached.
#> → Add `CheckArguments=FALSE` to suppress this warning or run `library('divent')`.
#> ! Function arguments cannot be checked because the package divent is not attached.
#> → Add `CheckArguments=FALSE` to suppress this warning or run `library('divent')`.
#> ! Function arguments cannot be checked because the package divent is not attached.
#> → Add `CheckArguments=FALSE` to suppress this warning or run `library('divent')`.
#> ! Function arguments cannot be checked because the package divent is not attached.
#> → Add `CheckArguments=FALSE` to suppress this warning or run `library('divent')`.
#> ! Function arguments cannot be checked because the package divent is not attached.
#> → Add `CheckArguments=FALSE` to suppress this warning or run `library('divent')`.
#> ! Function arguments cannot be checked because the package divent is not attached.
#> → Add `CheckArguments=FALSE` to suppress this warning or run `library('divent')`.
#> ! Function arguments cannot be checked because the package divent is not attached.
#> → Add `CheckArguments=FALSE` to suppress this warning or run `library('divent')`.
#> ! Function arguments cannot be checked because the package divent is not attached.
#> → Add `CheckArguments=FALSE` to suppress this warning or run `library('divent')`.
#> ! Function arguments cannot be checked because the package divent is not attached.
#> → Add `CheckArguments=FALSE` to suppress this warning or run `library('divent')`.
#> ! Function arguments cannot be checked because the package divent is not attached.
#> → Add `CheckArguments=FALSE` to suppress this warning or run `library('divent')`.
#> ! Function arguments cannot be checked because the package divent is not attached.
#> → Add `CheckArguments=FALSE` to suppress this warning or run `library('divent')`.
#> ! Function arguments cannot be checked because the package divent is not attached.
#> → Add `CheckArguments=FALSE` to suppress this warning or run `library('divent')`.
#> ! Function arguments cannot be checked because the package divent is not attached.
#> → Add `CheckArguments=FALSE` to suppress this warning or run `library('divent')`.
#> ! Function arguments cannot be checked because the package divent is not attached.
#> → Add `CheckArguments=FALSE` to suppress this warning or run `library('divent')`.
#> ! Function arguments cannot be checked because the package divent is not attached.
#> → Add `CheckArguments=FALSE` to suppress this warning or run `library('divent')`.
#> ! Function arguments cannot be checked because the package divent is not attached.
#> → Add `CheckArguments=FALSE` to suppress this warning or run `library('divent')`.
#> ! Function arguments cannot be checked because the package divent is not attached.
#> → Add `CheckArguments=FALSE` to suppress this warning or run `library('divent')`.
#> ! Function arguments cannot be checked because the package divent is not attached.
#> → Add `CheckArguments=FALSE` to suppress this warning or run `library('divent')`.
#> ! Function arguments cannot be checked because the package divent is not attached.
#> → Add `CheckArguments=FALSE` to suppress this warning or run `library('divent')`.
#> ! Function arguments cannot be checked because the package divent is not attached.
#> → Add `CheckArguments=FALSE` to suppress this warning or run `library('divent')`.
#> ! Function arguments cannot be checked because the package divent is not attached.
#> → Add `CheckArguments=FALSE` to suppress this warning or run `library('divent')`.
#> ! Function arguments cannot be checked because the package divent is not attached.
#> → Add `CheckArguments=FALSE` to suppress this warning or run `library('divent')`.
#> ! Function arguments cannot be checked because the package divent is not attached.
#> → Add `CheckArguments=FALSE` to suppress this warning or run `library('divent')`.
#> ! Function arguments cannot be checked because the package divent is not attached.
#> → Add `CheckArguments=FALSE` to suppress this warning or run `library('divent')`.
#> ! Function arguments cannot be checked because the package divent is not attached.
#> → Add `CheckArguments=FALSE` to suppress this warning or run `library('divent')`.
#> ! Function arguments cannot be checked because the package divent is not attached.
#> → Add `CheckArguments=FALSE` to suppress this warning or run `library('divent')`.
#> ! Function arguments cannot be checked because the package divent is not attached.
#> → Add `CheckArguments=FALSE` to suppress this warning or run `library('divent')`.
#> ! Function arguments cannot be checked because the package divent is not attached.
#> → Add `CheckArguments=FALSE` to suppress this warning or run `library('divent')`.
#> ! Function arguments cannot be checked because the package divent is not attached.
#> → Add `CheckArguments=FALSE` to suppress this warning or run `library('divent')`.
#> ! Function arguments cannot be checked because the package divent is not attached.
#> → Add `CheckArguments=FALSE` to suppress this warning or run `library('divent')`.
#> ! Function arguments cannot be checked because the package divent is not attached.
#> → Add `CheckArguments=FALSE` to suppress this warning or run `library('divent')`.
#> ! Function arguments cannot be checked because the package divent is not attached.
#> → Add `CheckArguments=FALSE` to suppress this warning or run `library('divent')`.
#> ! Function arguments cannot be checked because the package divent is not attached.
#> → Add `CheckArguments=FALSE` to suppress this warning or run `library('divent')`.
#> ! Function arguments cannot be checked because the package divent is not attached.
#> → Add `CheckArguments=FALSE` to suppress this warning or run `library('divent')`.
#> ! Function arguments cannot be checked because the package divent is not attached.
#> → Add `CheckArguments=FALSE` to suppress this warning or run `library('divent')`.
#> ! Function arguments cannot be checked because the package divent is not attached.
#> → Add `CheckArguments=FALSE` to suppress this warning or run `library('divent')`.
#> ! Function arguments cannot be checked because the package divent is not attached.
#> → Add `CheckArguments=FALSE` to suppress this warning or run `library('divent')`.
#> ! Function arguments cannot be checked because the package divent is not attached.
#> → Add `CheckArguments=FALSE` to suppress this warning or run `library('divent')`.
#> ! Function arguments cannot be checked because the package divent is not attached.
#> → Add `CheckArguments=FALSE` to suppress this warning or run `library('divent')`.
#> ! Function arguments cannot be checked because the package divent is not attached.
#> → Add `CheckArguments=FALSE` to suppress this warning or run `library('divent')`.
#> ! Function arguments cannot be checked because the package divent is not attached.
#> → Add `CheckArguments=FALSE` to suppress this warning or run `library('divent')`.
#> ! Function arguments cannot be checked because the package divent is not attached.
#> → Add `CheckArguments=FALSE` to suppress this warning or run `library('divent')`.
#> ! Function arguments cannot be checked because the package divent is not attached.
#> → Add `CheckArguments=FALSE` to suppress this warning or run `library('divent')`.
#> ! Function arguments cannot be checked because the package divent is not attached.
#> → Add `CheckArguments=FALSE` to suppress this warning or run `library('divent')`.
#> ! Function arguments cannot be checked because the package divent is not attached.
#> → Add `CheckArguments=FALSE` to suppress this warning or run `library('divent')`.
#> ! Function arguments cannot be checked because the package divent is not attached.
#> → Add `CheckArguments=FALSE` to suppress this warning or run `library('divent')`.
#> ! Function arguments cannot be checked because the package divent is not attached.
#> → Add `CheckArguments=FALSE` to suppress this warning or run `library('divent')`.
#> ! Function arguments cannot be checked because the package divent is not attached.
#> → Add `CheckArguments=FALSE` to suppress this warning or run `library('divent')`.
#> ! Function arguments cannot be checked because the package divent is not attached.
#> → Add `CheckArguments=FALSE` to suppress this warning or run `library('divent')`.
#> ! Function arguments cannot be checked because the package divent is not attached.
#> → Add `CheckArguments=FALSE` to suppress this warning or run `library('divent')`.
#> ! Function arguments cannot be checked because the package divent is not attached.
#> → Add `CheckArguments=FALSE` to suppress this warning or run `library('divent')`.
#> ! Function arguments cannot be checked because the package divent is not attached.
#> → Add `CheckArguments=FALSE` to suppress this warning or run `library('divent')`.
#> ! Function arguments cannot be checked because the package divent is not attached.
#> → Add `CheckArguments=FALSE` to suppress this warning or run `library('divent')`.
#> ! Function arguments cannot be checked because the package divent is not attached.
#> → Add `CheckArguments=FALSE` to suppress this warning or run `library('divent')`.
#> ! Function arguments cannot be checked because the package divent is not attached.
#> → Add `CheckArguments=FALSE` to suppress this warning or run `library('divent')`.
#> ! Function arguments cannot be checked because the package divent is not attached.
#> → Add `CheckArguments=FALSE` to suppress this warning or run `library('divent')`.
#> ! Function arguments cannot be checked because the package divent is not attached.
#> → Add `CheckArguments=FALSE` to suppress this warning or run `library('divent')`.
#> ! Function arguments cannot be checked because the package divent is not attached.
#> → Add `CheckArguments=FALSE` to suppress this warning or run `library('divent')`.
#> ! Function arguments cannot be checked because the package divent is not attached.
#> → Add `CheckArguments=FALSE` to suppress this warning or run `library('divent')`.
#> ! Function arguments cannot be checked because the package divent is not attached.
#> → Add `CheckArguments=FALSE` to suppress this warning or run `library('divent')`.
#> ! Function arguments cannot be checked because the package divent is not attached.
#> → Add `CheckArguments=FALSE` to suppress this warning or run `library('divent')`.
#> ! Function arguments cannot be checked because the package divent is not attached.
#> → Add `CheckArguments=FALSE` to suppress this warning or run `library('divent')`.
#> ! Function arguments cannot be checked because the package divent is not attached.
#> → Add `CheckArguments=FALSE` to suppress this warning or run `library('divent')`.
#> ! Function arguments cannot be checked because the package divent is not attached.
#> → Add `CheckArguments=FALSE` to suppress this warning or run `library('divent')`.
#> ! Function arguments cannot be checked because the package divent is not attached.
#> → Add `CheckArguments=FALSE` to suppress this warning or run `library('divent')`.
#> ! Function arguments cannot be checked because the package divent is not attached.
#> → Add `CheckArguments=FALSE` to suppress this warning or run `library('divent')`.
#> ! Function arguments cannot be checked because the package divent is not attached.
#> → Add `CheckArguments=FALSE` to suppress this warning or run `library('divent')`.
#> ! Function arguments cannot be checked because the package divent is not attached.
#> → Add `CheckArguments=FALSE` to suppress this warning or run `library('divent')`.
#> ! Function arguments cannot be checked because the package divent is not attached.
#> → Add `CheckArguments=FALSE` to suppress this warning or run `library('divent')`.
#> ! Function arguments cannot be checked because the package divent is not attached.
#> → Add `CheckArguments=FALSE` to suppress this warning or run `library('divent')`.
#> ! Function arguments cannot be checked because the package divent is not attached.
#> → Add `CheckArguments=FALSE` to suppress this warning or run `library('divent')`.
#> ! Function arguments cannot be checked because the package divent is not attached.
#> → Add `CheckArguments=FALSE` to suppress this warning or run `library('divent')`.
#> ! Function arguments cannot be checked because the package divent is not attached.
#> → Add `CheckArguments=FALSE` to suppress this warning or run `library('divent')`.
#> ! Function arguments cannot be checked because the package divent is not attached.
#> → Add `CheckArguments=FALSE` to suppress this warning or run `library('divent')`.
#> ! Function arguments cannot be checked because the package divent is not attached.
#> → Add `CheckArguments=FALSE` to suppress this warning or run `library('divent')`.
#> ! Function arguments cannot be checked because the package divent is not attached.
#> → Add `CheckArguments=FALSE` to suppress this warning or run `library('divent')`.
#> ! Function arguments cannot be checked because the package divent is not attached.
#> → Add `CheckArguments=FALSE` to suppress this warning or run `library('divent')`.
#> ! Function arguments cannot be checked because the package divent is not attached.
#> → Add `CheckArguments=FALSE` to suppress this warning or run `library('divent')`.
#> ! Function arguments cannot be checked because the package divent is not attached.
#> → Add `CheckArguments=FALSE` to suppress this warning or run `library('divent')`.
#> ! Function arguments cannot be checked because the package divent is not attached.
#> → Add `CheckArguments=FALSE` to suppress this warning or run `library('divent')`.
#> ! Function arguments cannot be checked because the package divent is not attached.
#> → Add `CheckArguments=FALSE` to suppress this warning or run `library('divent')`.
#> ! Function arguments cannot be checked because the package divent is not attached.
#> → Add `CheckArguments=FALSE` to suppress this warning or run `library('divent')`.
#> ! Function arguments cannot be checked because the package divent is not attached.
#> → Add `CheckArguments=FALSE` to suppress this warning or run `library('divent')`.
#> ! Function arguments cannot be checked because the package divent is not attached.
#> → Add `CheckArguments=FALSE` to suppress this warning or run `library('divent')`.
#> ! Function arguments cannot be checked because the package divent is not attached.
#> → Add `CheckArguments=FALSE` to suppress this warning or run `library('divent')`.
#> ! Function arguments cannot be checked because the package divent is not attached.
#> → Add `CheckArguments=FALSE` to suppress this warning or run `library('divent')`.
#> ! Function arguments cannot be checked because the package divent is not attached.
#> → Add `CheckArguments=FALSE` to suppress this warning or run `library('divent')`.
#> ! Function arguments cannot be checked because the package divent is not attached.
#> → Add `CheckArguments=FALSE` to suppress this warning or run `library('divent')`.
#> ! Function arguments cannot be checked because the package divent is not attached.
#> → Add `CheckArguments=FALSE` to suppress this warning or run `library('divent')`.
#> ! Function arguments cannot be checked because the package divent is not attached.
#> → Add `CheckArguments=FALSE` to suppress this warning or run `library('divent')`.
#> ! Function arguments cannot be checked because the package divent is not attached.
#> → Add `CheckArguments=FALSE` to suppress this warning or run `library('divent')`.
#> ! Function arguments cannot be checked because the package divent is not attached.
#> → Add `CheckArguments=FALSE` to suppress this warning or run `library('divent')`.
#> ! Function arguments cannot be checked because the package divent is not attached.
#> → Add `CheckArguments=FALSE` to suppress this warning or run `library('divent')`.
#> ! Function arguments cannot be checked because the package divent is not attached.
#> → Add `CheckArguments=FALSE` to suppress this warning or run `library('divent')`.
#> ! Function arguments cannot be checked because the package divent is not attached.
#> → Add `CheckArguments=FALSE` to suppress this warning or run `library('divent')`.
#> ! Function arguments cannot be checked because the package divent is not attached.
#> → Add `CheckArguments=FALSE` to suppress this warning or run `library('divent')`.
#> ! Function arguments cannot be checked because the package divent is not attached.
#> → Add `CheckArguments=FALSE` to suppress this warning or run `library('divent')`.
#> ! Function arguments cannot be checked because the package divent is not attached.
#> → Add `CheckArguments=FALSE` to suppress this warning or run `library('divent')`.
#> ! Function arguments cannot be checked because the package divent is not attached.
#> → Add `CheckArguments=FALSE` to suppress this warning or run `library('divent')`.
#> ! Function arguments cannot be checked because the package divent is not attached.
#> → Add `CheckArguments=FALSE` to suppress this warning or run `library('divent')`.
#> ! Function arguments cannot be checked because the package divent is not attached.
#> → Add `CheckArguments=FALSE` to suppress this warning or run `library('divent')`.
#> ! Function arguments cannot be checked because the package divent is not attached.
#> → Add `CheckArguments=FALSE` to suppress this warning or run `library('divent')`.
#> ! Function arguments cannot be checked because the package divent is not attached.
#> → Add `CheckArguments=FALSE` to suppress this warning or run `library('divent')`.
#> ! Function arguments cannot be checked because the package divent is not attached.
#> → Add `CheckArguments=FALSE` to suppress this warning or run `library('divent')`.
#> ! Function arguments cannot be checked because the package divent is not attached.
#> → Add `CheckArguments=FALSE` to suppress this warning or run `library('divent')`.
#> ! Function arguments cannot be checked because the package divent is not attached.
#> → Add `CheckArguments=FALSE` to suppress this warning or run `library('divent')`.
#> ! Function arguments cannot be checked because the package divent is not attached.
#> → Add `CheckArguments=FALSE` to suppress this warning or run `library('divent')`.
#> ! Function arguments cannot be checked because the package divent is not attached.
#> → Add `CheckArguments=FALSE` to suppress this warning or run `library('divent')`.
#> ! Function arguments cannot be checked because the package divent is not attached.
#> → Add `CheckArguments=FALSE` to suppress this warning or run `library('divent')`.
#> ! Function arguments cannot be checked because the package divent is not attached.
#> → Add `CheckArguments=FALSE` to suppress this warning or run `library('divent')`.
#> ! Function arguments cannot be checked because the package divent is not attached.
#> → Add `CheckArguments=FALSE` to suppress this warning or run `library('divent')`.
#> ! Function arguments cannot be checked because the package divent is not attached.
#> → Add `CheckArguments=FALSE` to suppress this warning or run `library('divent')`.
#> ! Function arguments cannot be checked because the package divent is not attached.
#> → Add `CheckArguments=FALSE` to suppress this warning or run `library('divent')`.
#> ! Function arguments cannot be checked because the package divent is not attached.
#> → Add `CheckArguments=FALSE` to suppress this warning or run `library('divent')`.
#> ! Function arguments cannot be checked because the package divent is not attached.
#> → Add `CheckArguments=FALSE` to suppress this warning or run `library('divent')`.
#> ! Function arguments cannot be checked because the package divent is not attached.
#> → Add `CheckArguments=FALSE` to suppress this warning or run `library('divent')`.
#> ! Function arguments cannot be checked because the package divent is not attached.
#> → Add `CheckArguments=FALSE` to suppress this warning or run `library('divent')`.
#> ! Function arguments cannot be checked because the package divent is not attached.
#> → Add `CheckArguments=FALSE` to suppress this warning or run `library('divent')`.
#> ! Function arguments cannot be checked because the package divent is not attached.
#> → Add `CheckArguments=FALSE` to suppress this warning or run `library('divent')`.
#> ! Function arguments cannot be checked because the package divent is not attached.
#> → Add `CheckArguments=FALSE` to suppress this warning or run `library('divent')`.
#> ! Function arguments cannot be checked because the package divent is not attached.
#> → Add `CheckArguments=FALSE` to suppress this warning or run `library('divent')`.
#> ! Function arguments cannot be checked because the package divent is not attached.
#> → Add `CheckArguments=FALSE` to suppress this warning or run `library('divent')`.
#> ! Function arguments cannot be checked because the package divent is not attached.
#> → Add `CheckArguments=FALSE` to suppress this warning or run `library('divent')`.
#> ! Function arguments cannot be checked because the package divent is not attached.
#> → Add `CheckArguments=FALSE` to suppress this warning or run `library('divent')`.
#> ! Function arguments cannot be checked because the package divent is not attached.
#> → Add `CheckArguments=FALSE` to suppress this warning or run `library('divent')`.
#> ! Function arguments cannot be checked because the package divent is not attached.
#> → Add `CheckArguments=FALSE` to suppress this warning or run `library('divent')`.
#> ! Function arguments cannot be checked because the package divent is not attached.
#> → Add `CheckArguments=FALSE` to suppress this warning or run `library('divent')`.
#> ! Function arguments cannot be checked because the package divent is not attached.
#> → Add `CheckArguments=FALSE` to suppress this warning or run `library('divent')`.
#> ! Function arguments cannot be checked because the package divent is not attached.
#> → Add `CheckArguments=FALSE` to suppress this warning or run `library('divent')`.
#> ! Function arguments cannot be checked because the package divent is not attached.
#> → Add `CheckArguments=FALSE` to suppress this warning or run `library('divent')`.
#> ! Function arguments cannot be checked because the package divent is not attached.
#> → Add `CheckArguments=FALSE` to suppress this warning or run `library('divent')`.
#> ! Function arguments cannot be checked because the package divent is not attached.
#> → Add `CheckArguments=FALSE` to suppress this warning or run `library('divent')`.
#> ! Function arguments cannot be checked because the package divent is not attached.
#> → Add `CheckArguments=FALSE` to suppress this warning or run `library('divent')`.
#> ! Function arguments cannot be checked because the package divent is not attached.
#> → Add `CheckArguments=FALSE` to suppress this warning or run `library('divent')`.
#> ! Function arguments cannot be checked because the package divent is not attached.
#> → Add `CheckArguments=FALSE` to suppress this warning or run `library('divent')`.
#> ! Function arguments cannot be checked because the package divent is not attached.
#> → Add `CheckArguments=FALSE` to suppress this warning or run `library('divent')`.
#> ! Function arguments cannot be checked because the package divent is not attached.
#> → Add `CheckArguments=FALSE` to suppress this warning or run `library('divent')`.
#> ! Function arguments cannot be checked because the package divent is not attached.
#> → Add `CheckArguments=FALSE` to suppress this warning or run `library('divent')`.
#> ! Function arguments cannot be checked because the package divent is not attached.
#> → Add `CheckArguments=FALSE` to suppress this warning or run `library('divent')`.
#> ! Function arguments cannot be checked because the package divent is not attached.
#> → Add `CheckArguments=FALSE` to suppress this warning or run `library('divent')`.
#> ! Function arguments cannot be checked because the package divent is not attached.
#> → Add `CheckArguments=FALSE` to suppress this warning or run `library('divent')`.
#> ! Function arguments cannot be checked because the package divent is not attached.
#> → Add `CheckArguments=FALSE` to suppress this warning or run `library('divent')`.
#> Warning: extreme order statistics used as endpoints
#> Warning: Error processing 'fungi_with_less_otu_in_High': missing value where TRUE/FALSE needed

results$summary
#> # A tibble: 18 × 9
#>    name         metric comparison  effect_size ci_lower ci_upper pvalue_permtest
#>    <chr>        <chr>  <chr>             <dbl>    <dbl>    <dbl>           <dbl>
#>  1 fungi        Hill_0 High vs Low      0.205        NA       NA           0.462
#>  2 fungi        Hill_0 High vs Mi…      0.136        NA       NA           0.601
#>  3 fungi        Hill_1 High vs Low     -0.315        NA       NA           0.25
#>  4 fungi        Hill_1 High vs Mi…      0.0312       NA       NA           0.905
#>  5 fungi        Hill_2 High vs Low     -0.306        NA       NA           0.263
#>  6 fungi        Hill_2 High vs Mi…      0.0837       NA       NA           0.747
#>  7 fungi_clust  Hill_0 High vs Low      0.116        NA       NA           0.67
#>  8 fungi_clust  Hill_0 High vs Mi…      0.0781       NA       NA           0.763
#>  9 fungi_clust  Hill_1 High vs Low     -0.233        NA       NA           0.399
#> 10 fungi_clust  Hill_1 High vs Mi…      0.112        NA       NA           0.678
#> 11 fungi_clust  Hill_2 High vs Low     -0.218        NA       NA           0.434
#> 12 fungi_clust  Hill_2 High vs Mi…      0.197        NA       NA           0.467
#> 13 fungi_rarefy Hill_0 High vs Low      0.202        NA       NA           0.724
#> 14 fungi_rarefy Hill_0 High vs Mi…      0.112        NA       NA           0.670
#> 15 fungi_rarefy Hill_1 High vs Low     -0.318        NA       NA           0.247
#> 16 fungi_rarefy Hill_1 High vs Mi…      0.0166       NA       NA           0.947
#> 17 fungi_rarefy Hill_2 High vs Low     -0.302        NA       NA           0.267
#> 18 fungi_rarefy Hill_2 High vs Mi…      0.0744       NA       NA           0.775
#> # ℹ 2 more variables: pvalue_welch <dbl>, pvalue_mann_whitney <dbl>

# Plot results for two phyloseq objects
 ggplot(results$summary, aes(x = metric, y = effect_size, color=name)) +
   facet_wrap(~comparison) +
   geom_point(position=position_dodge(width=0.5)) +
   geom_errorbar(aes(ymin = ci_lower, ymax = ci_upper), width = 0.2, position=position_dodge(width=0.5 ))