Plot the full history of every logged run, including reruns
Source:R/ga_autometric_runs.R
ga_autometric_history.Rd

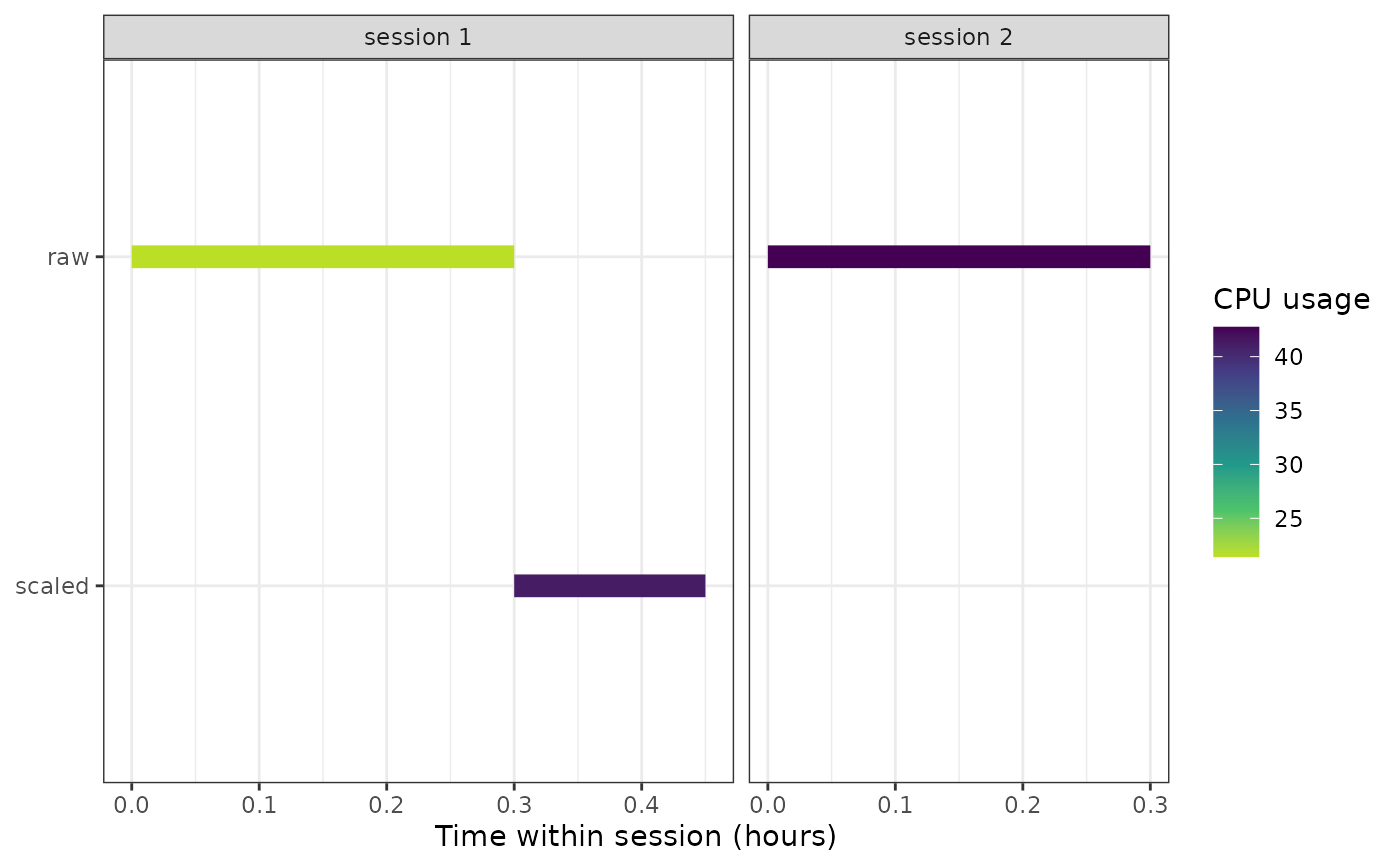
Draw a Gantt-style timeline of every process run recorded in an
autometric log, faceted by pipeline session. Each (pid, phase)
execution becomes a horizontal segment from its start to its end time,
colored by mean CPU usage.
A log usually accumulates several pipeline executions that can be days or
weeks apart, so plotting them on one absolute time axis would squeeze every
run into an invisible sliver. Runs are therefore grouped into sessions
(consecutive runs separated by a gap larger than session_gap) and drawn in
their own facet with a session-relative time axis. A target rebuilt in
several sessions appears in several facets, which exposes the trial-and-error
and re-run cost that the "last run only" views
(ga_targets_meta_plot(), ga_autometric_lastrun())
hide by design. This full-history view is the closest to greenAlgoR's
original motivation of accounting for the whole development cost of a
pipeline, not just its final build.
Usage
ga_autometric_history(
  log,
  units_time = "hours",
  units_memory = "gigabytes",
  session_gap = 1,
  min_duration = 0,
  ...
)
Arguments
- log
Either a path to an
autometriclog file (read withautometric::log_read()) or a data frame already returned byautometric::log_read()(with at least the columnspid,phase,time,cpu).- units_time, units_memory
Passed to
autometric::log_read()whenlogis a file path (defaults"hours"and"gigabytes").- session_gap
(numeric, default
1) Gap, expressed inunits_time, above which two consecutive runs are considered to belong to different pipeline sessions (facets). Increase it to merge runs into fewer sessions, decrease it to split more finely. Set toInfto force a single session.- min_duration
(numeric, default
0) Drop runs shorter than this duration (inunits_time). Useful to hide near-instant phases and keep the figure legible.- ...
Additional arguments forwarded to
autometric::log_read().
Value
A ggplot object: one facet per session, each
with one segment per logged run.
Examples
if (requireNamespace("autometric", quietly = TRUE)) {
  log_df <- data.frame(
    version = "0.1.2",
    phase = c(rep("raw", 4), rep("scaled", 4), rep("raw", 4)),
    pid = c(rep(1L, 4), rep(2L, 4), rep(3L, 4)),
    name = "local",
    status = 0L,
    # Two sessions: the first at t ~ 0 h, a "raw" rerun ~ 5 h later.
    time = c(0, 0.1, 0.2, 0.3, 0.3, 0.35, 0.4, 0.45, 5.0, 5.1, 5.2, 5.3),
    core = runif(12, 0, 40),
    cpu = runif(12, 0, 90),
    resident = runif(12, 70, 90),
    virtual = runif(12, 900, 1000)
  )
  ga_autometric_history(log_df)
}