Plot resource-usage logs recorded by the autometric package
Source: R/ga_autometric_plot.R
ga_autometric_plot.Rd

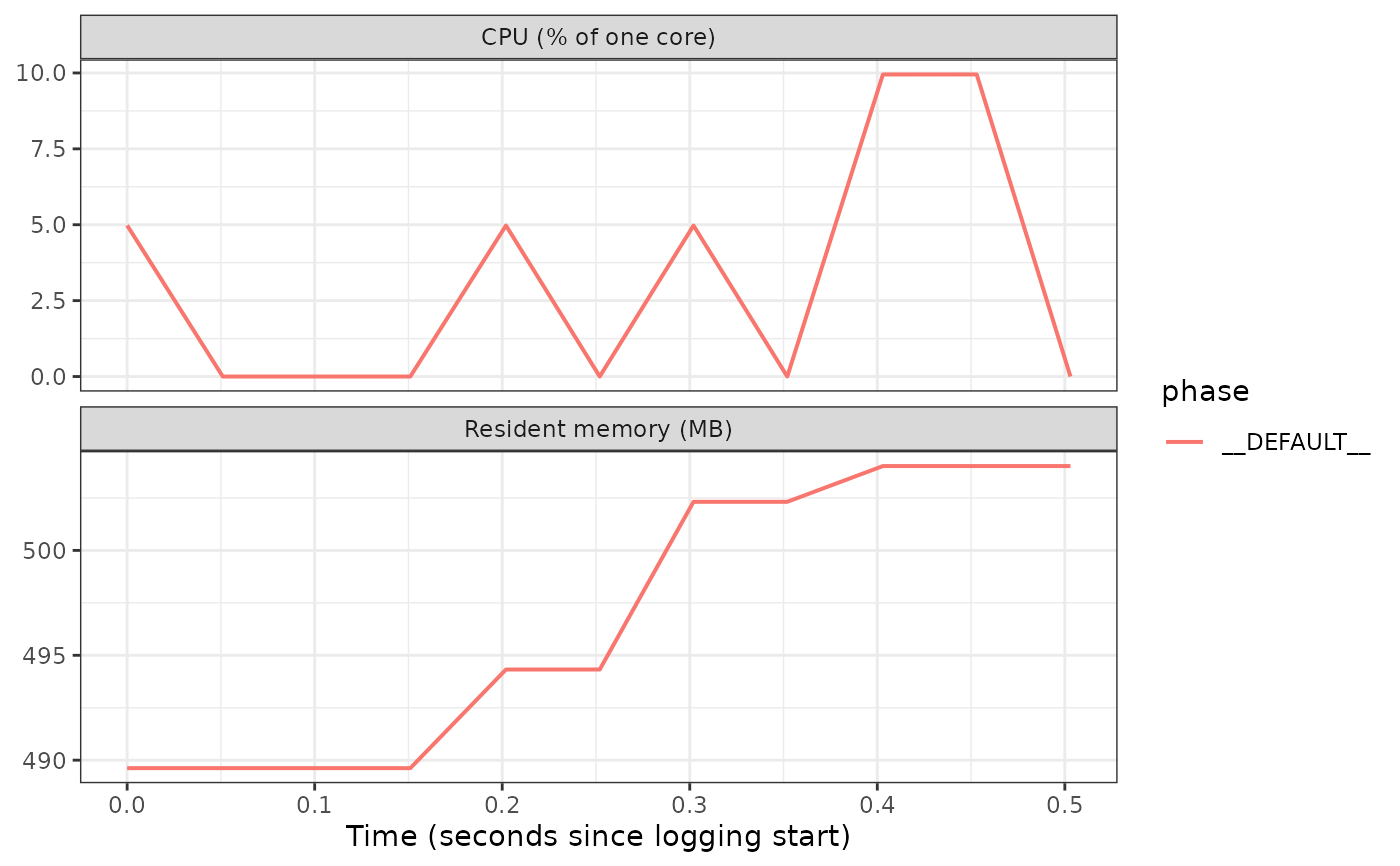
Render a ggplot of the CPU and memory usage recorded
by autometric::log_start() / autometric::log_stop(). Each
selected metric is drawn as a line over time, faceted so that percentage
metrics (CPU) and megabyte metrics (memory) keep their own y-axis scale.
This turns an autometric log into a publication-ready resource-usage
figure and pairs naturally with the carbon-footprint estimates of
ga_footprint().
Usage
ga_autometric_plot(
  log,
  metrics = c("cpu", "resident"),
  color_by = "phase",
  ...
)
Arguments
- log
Either a path to an
autometriclog file (read withautometric::log_read()) or a data frame already returned byautometric::log_read()(with at least the columnstime,cpu,core,resident,virtual).- metrics
(character, default
c("cpu", "resident")) Which columns to plot. Any subset of "cpu" (\ "resident" (resident memory, MB) and "virtual" (virtual memory, MB).- color_by
(character, default "phase") Column used to color the lines, typically "phase", "name" or "pid" so several logged phases or processes can be compared on one plot.
- ...
Additional arguments passed on to
autometric::log_read()whenlogis a file path.
Value
A ggplot object with one facet per metric.