The fastqcr package allow to check fastq quality and build reports about multiple fastq files. We also present here how to plot base quality using the Rsearch package.
Load the necessary packages
## Loading required package: phyloseq## Loading required package: ggplot2## Loading required package: dada2## Loading required package: Rcpp## Loading required package: dplyr##
## Attaching package: 'dplyr'## The following objects are masked from 'package:stats':
##
## filter, lag## The following objects are masked from 'package:base':
##
## intersect, setdiff, setequal, union## Loading required package: purrrRun the analysis
qc.dir <- "fastqc_results"

# Demo QC directory containing zipped FASTQC reports
fastq_dir <- list_fastq_files(system.file("/extdata", package = "MiscMetabar"))
fastqcr::fastqc(dirname(fastq_dir[[1]]), qc.dir = qc.dir)
qc <- fastqcr::qc_aggregate(qc.dir)
fastqcr::qc_problems(qc)
fastqcr::qc_stats(qc)
summary(qc)
Plot base quality with Rsearch package
library(Rsearch)

fastq_dir <- list_fastq_files(system.file("/extdata", package = "MiscMetabar"))

qual_plots <- plot_base_quality(
  fastq_input = fastq_dir$fnfs,
  reverse = fastq_dir$reverse
)
print(qual_plots)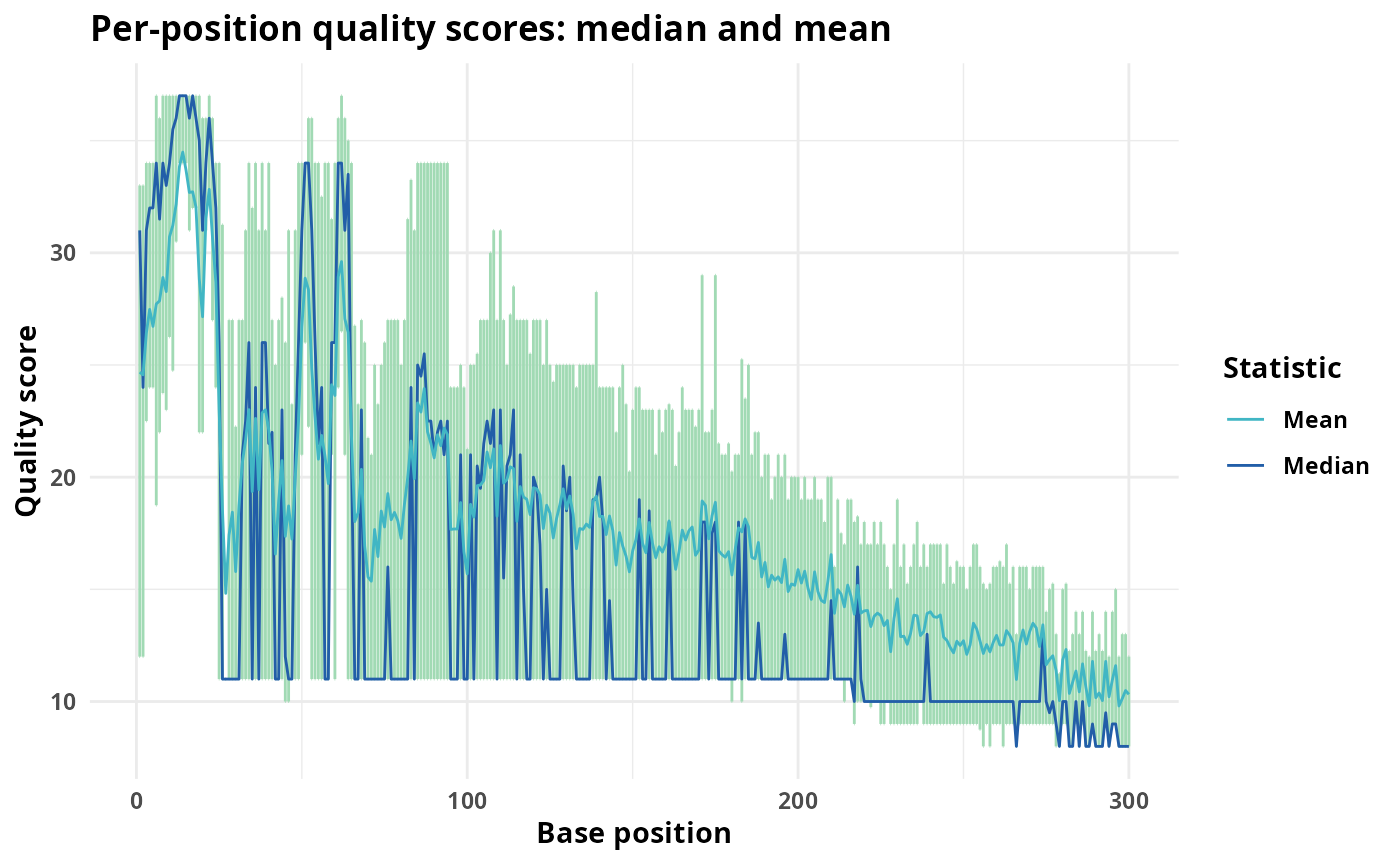
Build reports
# Building Multi QC Reports
fastqcr::qc_report(qc.dir, result.file = "multi-qc-report")

# Building One-Sample QC Reports (+ Interpretation)
qc.file <- system.file("fastqc_results", "S1_fastqc.zip", package = "fastqcr")
fastqcr::qc_report(qc.file, result.file = "one-sample-report", interpret = TRUE)