This tutorial explore a phyloseq version of the dataset from Tengeler
et al. (2020) available in the mia package.
Load library
library("MicrobiotaProcess")
library("MiscMetabar")
library("ggplot2")
library("patchwork")
library("iNEXT")
?Tengeler2020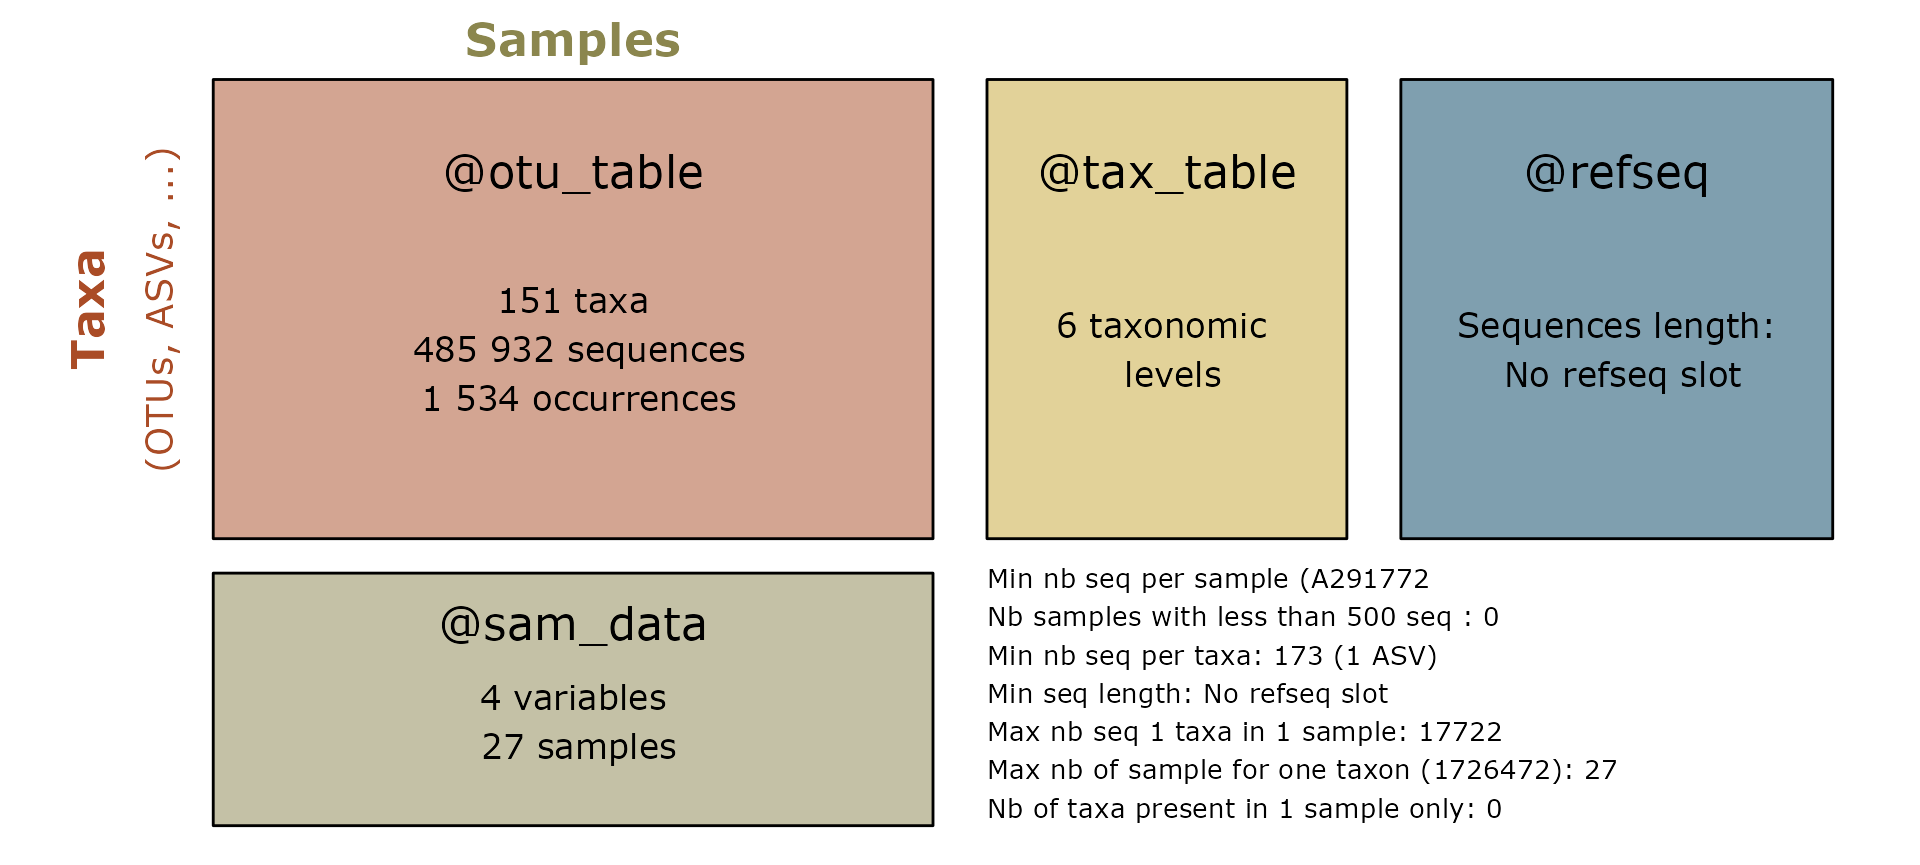
Alpha-diversity analysis
hill_pq(ten, "patient_status", one_plot = TRUE)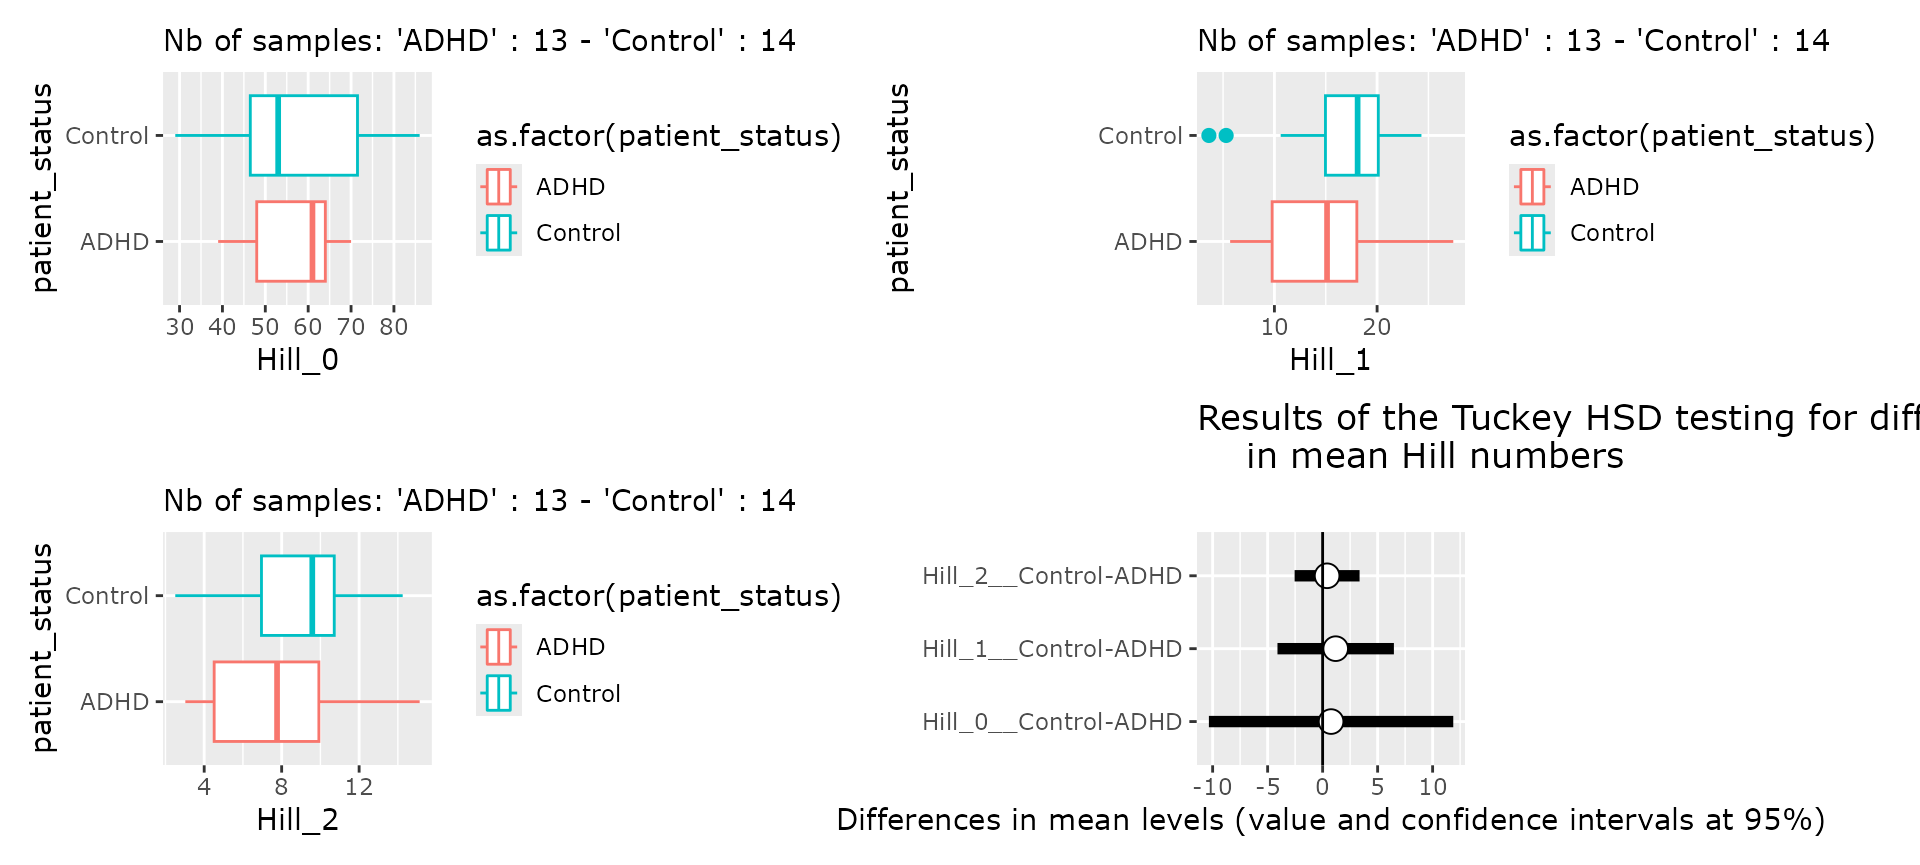
res_inext <-
  iNEXT_pq(ten,
    datatype = "abundance",
    merge_sample_by = "patient_status_vs_cohort",
    nboot = 5
  )
ggiNEXT(res_inext)
#> Warning: `aes_string()` was deprecated in ggplot2 3.0.0.
#> ℹ Please use tidy evaluation idioms with `aes()`.
#> ℹ See also `vignette("ggplot2-in-packages")` for more information.
#> ℹ The deprecated feature was likely used in the iNEXT package.
#>   Please report the issue at <https://github.com/AnneChao/iNEXT/issues>.
#> This warning is displayed once per session.
#> Call `lifecycle::last_lifecycle_warnings()` to see where this warning was
#> generated.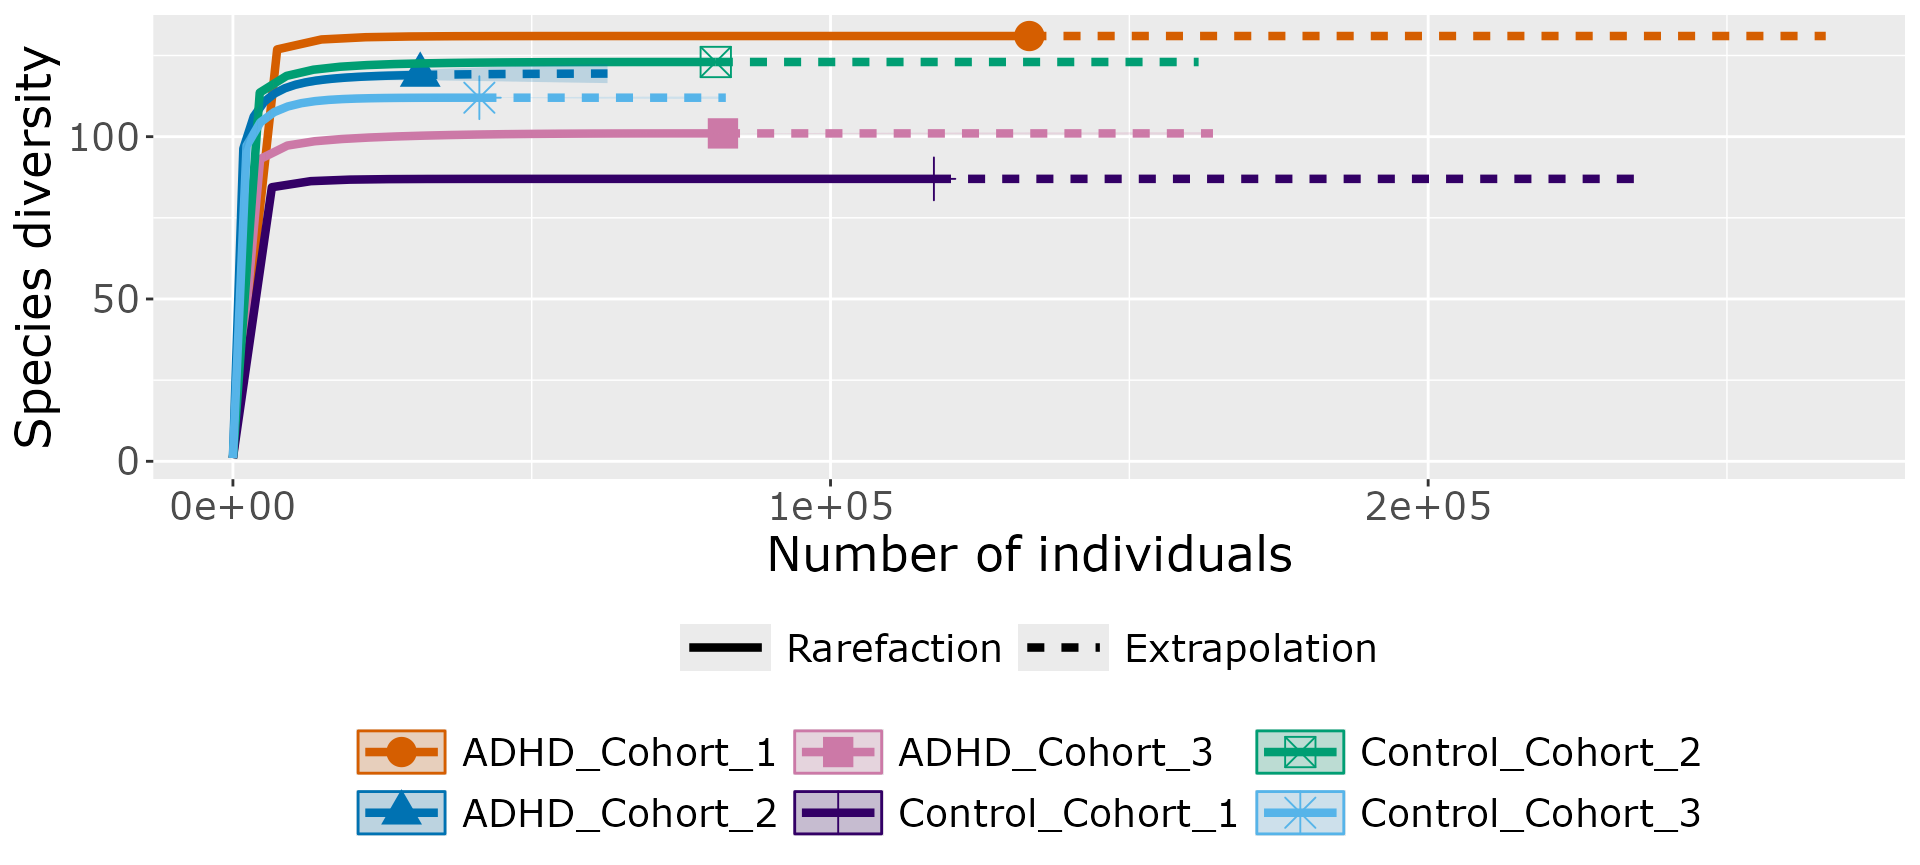
accu_plot(
  ten,
  fact = "sample_name",
  add_nb_seq = TRUE,
  by.fact = TRUE,
  step = 100
) + theme(legend.position = c(0.8, 0.6))
#> Warning in vegan::rarefy(as.matrix(unclass(x[i, ])), n, se = TRUE): most
#> observed count data have counts 1, but smallest count is 9
#> Warning in vegan::rarefy(as.matrix(unclass(x[i, ])), n, se = TRUE): most
#> observed count data have counts 1, but smallest count is 17
#> Warning in vegan::rarefy(as.matrix(unclass(x[i, ])), n, se = TRUE): most
#> observed count data have counts 1, but smallest count is 25
#> Warning in vegan::rarefy(as.matrix(unclass(x[i, ])), n, se = TRUE): most
#> observed count data have counts 1, but smallest count is 7
#> Warning in vegan::rarefy(as.matrix(unclass(x[i, ])), n, se = TRUE): most
#> observed count data have counts 1, but smallest count is 8
#> Warning in vegan::rarefy(as.matrix(unclass(x[i, ])), n, se = TRUE): most
#> observed count data have counts 1, but smallest count is 6
#> Warning in vegan::rarefy(as.matrix(unclass(x[i, ])), n, se = TRUE): most
#> observed count data have counts 1, but smallest count is 14
#> Warning in vegan::rarefy(as.matrix(unclass(x[i, ])), n, se = TRUE): most
#> observed count data have counts 1, but smallest count is 28
#> Warning in vegan::rarefy(as.matrix(unclass(x[i, ])), n, se = TRUE): most
#> observed count data have counts 1, but smallest count is 3
#> Warning in vegan::rarefy(as.matrix(unclass(x[i, ])), n, se = TRUE): most
#> observed count data have counts 1, but smallest count is 7
#> Warning in vegan::rarefy(as.matrix(unclass(x[i, ])), n, se = TRUE): most
#> observed count data have counts 1, but smallest count is 2
#> Warning in vegan::rarefy(as.matrix(unclass(x[i, ])), n, se = TRUE): most
#> observed count data have counts 1, but smallest count is 15
#> Warning in vegan::rarefy(as.matrix(unclass(x[i, ])), n, se = TRUE): most
#> observed count data have counts 1, but smallest count is 5
#> Warning in vegan::rarefy(as.matrix(unclass(x[i, ])), n, se = TRUE): most
#> observed count data have counts 1, but smallest count is 5
#> Warning in vegan::rarefy(as.matrix(unclass(x[i, ])), n, se = TRUE): most
#> observed count data have counts 1, but smallest count is 3
#> Warning in vegan::rarefy(as.matrix(unclass(x[i, ])), n, se = TRUE): most
#> observed count data have counts 1, but smallest count is 6
#> Warning in vegan::rarefy(as.matrix(unclass(x[i, ])), n, se = TRUE): most
#> observed count data have counts 1, but smallest count is 3
#> Warning in vegan::rarefy(as.matrix(unclass(x[i, ])), n, se = TRUE): most
#> observed count data have counts 1, but smallest count is 4
#> Warning in vegan::rarefy(as.matrix(unclass(x[i, ])), n, se = TRUE): most
#> observed count data have counts 1, but smallest count is 6
#> Warning in vegan::rarefy(as.matrix(unclass(x[i, ])), n, se = TRUE): most
#> observed count data have counts 1, but smallest count is 3
#> Warning in vegan::rarefy(as.matrix(unclass(x[i, ])), n, se = TRUE): most
#> observed count data have counts 1, but smallest count is 3
#> Warning in vegan::rarefy(as.matrix(unclass(x[i, ])), n, se = TRUE): most
#> observed count data have counts 1, but smallest count is 21
#> Warning in vegan::rarefy(as.matrix(unclass(x[i, ])), n, se = TRUE): most
#> observed count data have counts 1, but smallest count is 5
#> Warning in vegan::rarefy(as.matrix(unclass(x[i, ])), n, se = TRUE): most
#> observed count data have counts 1, but smallest count is 13
#> Warning: Removed 1 row containing missing values or values outside the scale range
#> (`geom_ribbon()`).
#> Warning: Removed 1 row containing missing values or values outside the scale range
#> (`geom_line()`).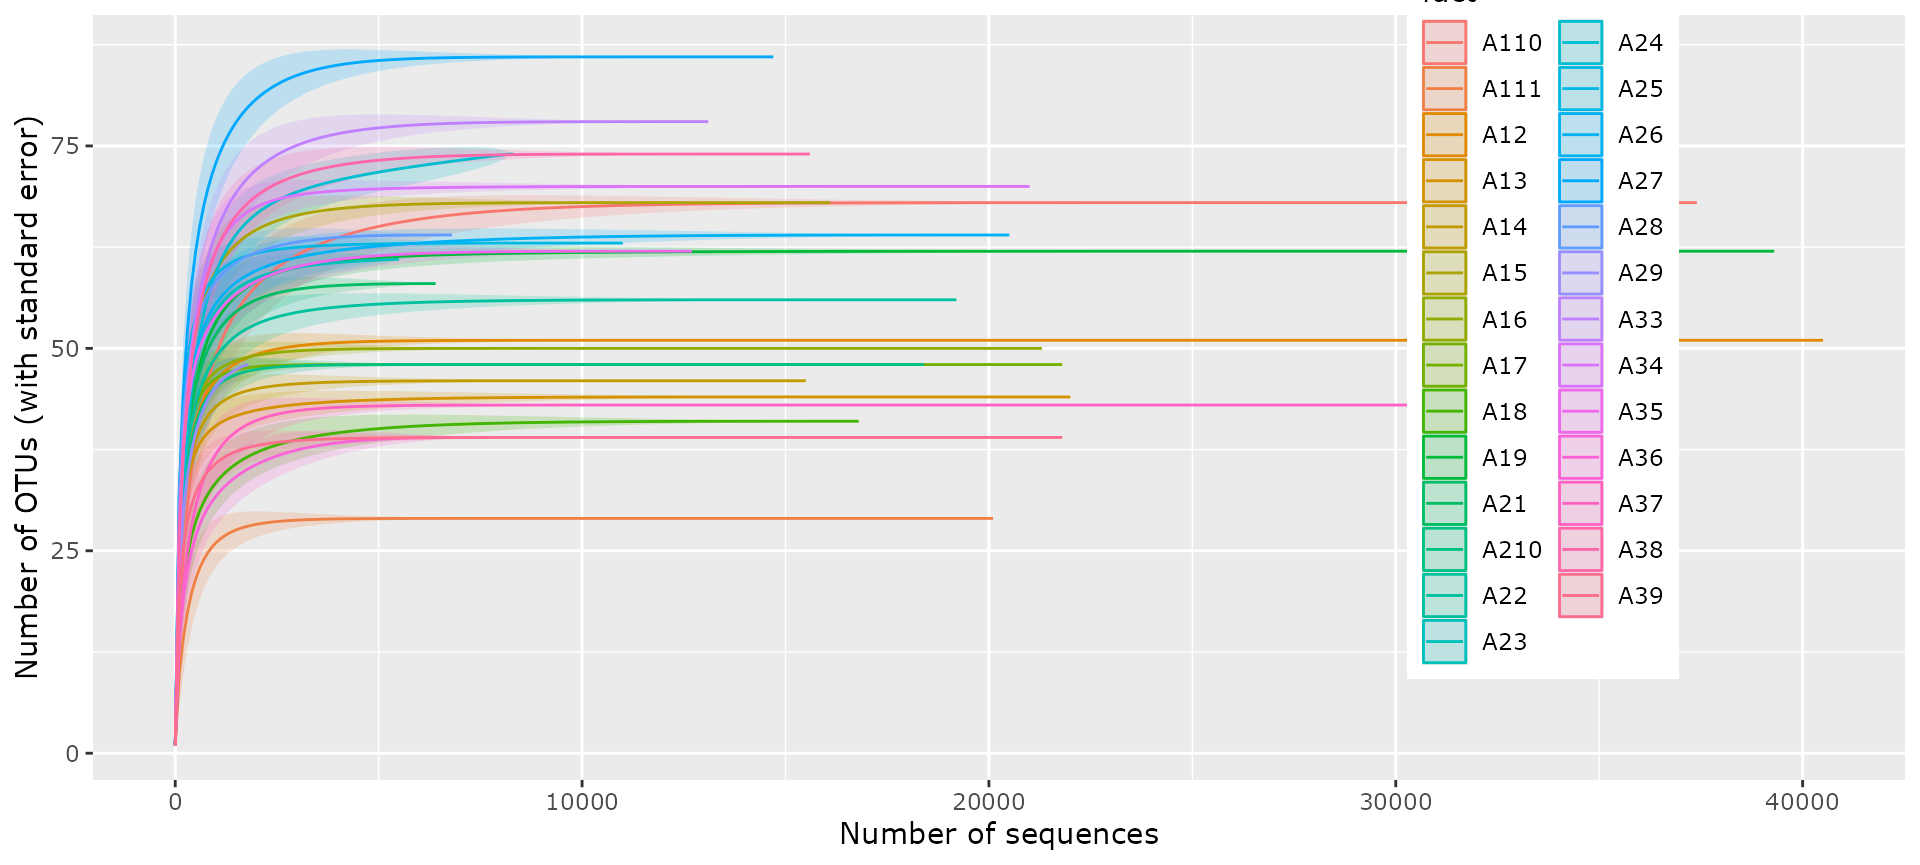
Explore taxonomy
# library(metacoder)
# heat_tree_pq(
#   ten,
#   node_size = n_obs,
#   node_color = nb_sequences,
#   node_label = taxon_names,
#   tree_label = taxon_names,
#   node_size_trans = "log10 area"
# )
treemap_pq(ten, lvl1 = "Order", lvl2 = "Family")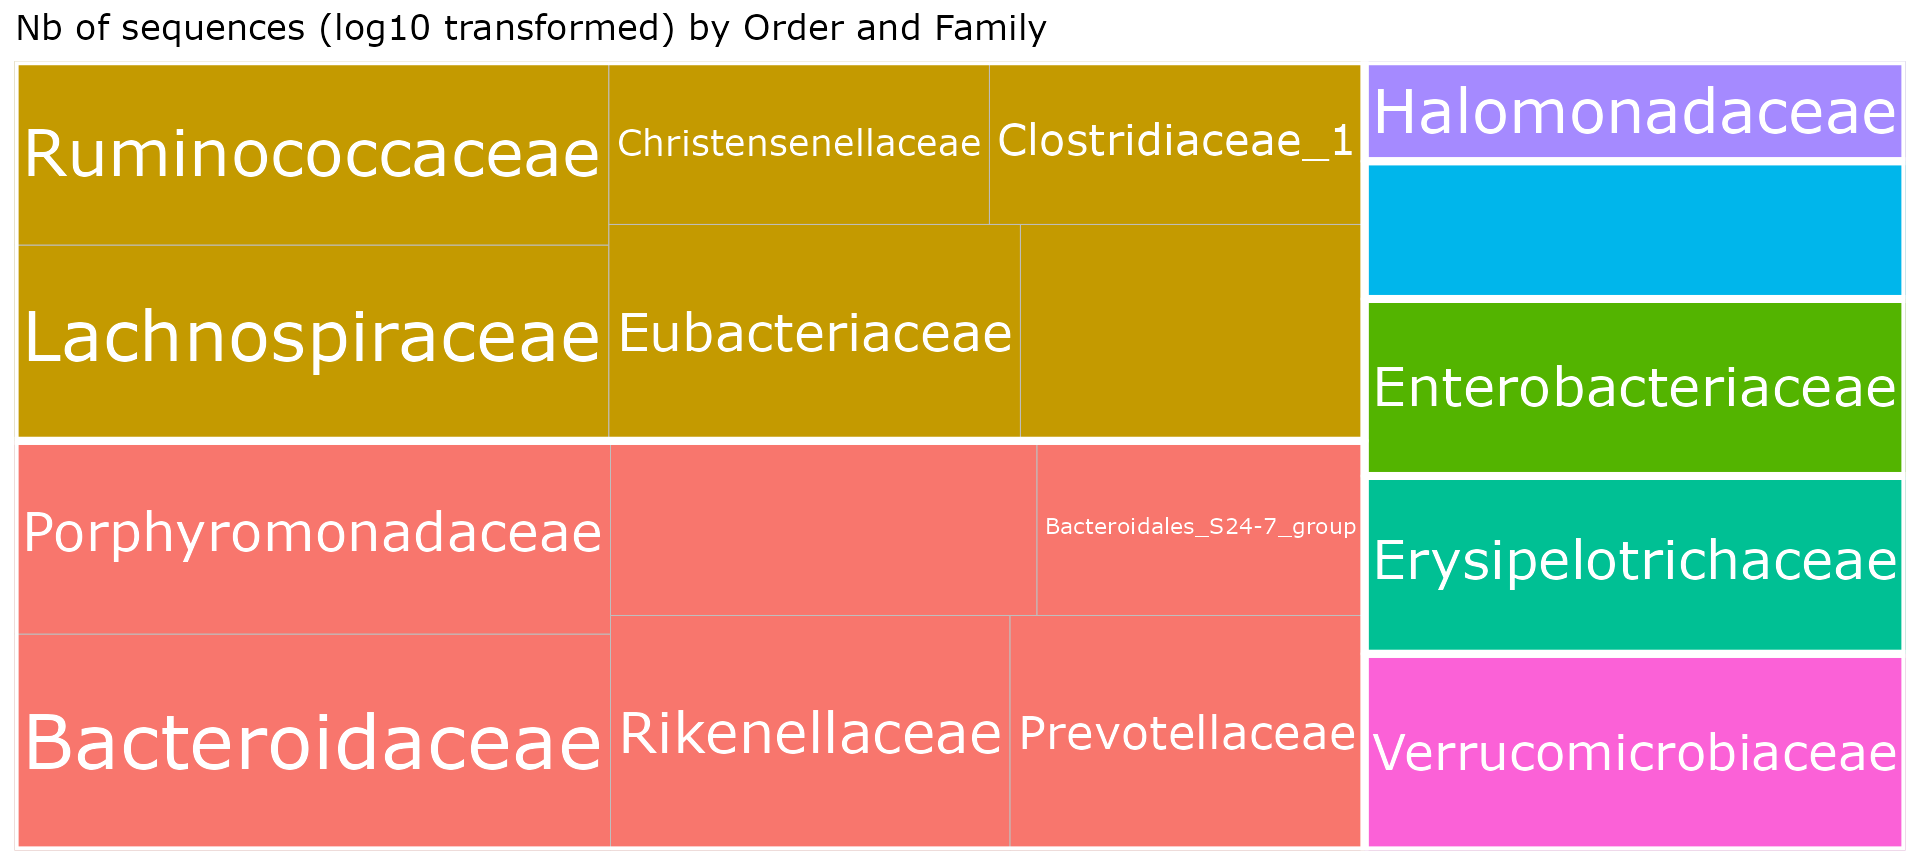
Beta-diversity analysis : effect of patient status and cohort
circle_pq(ten, "patient_status")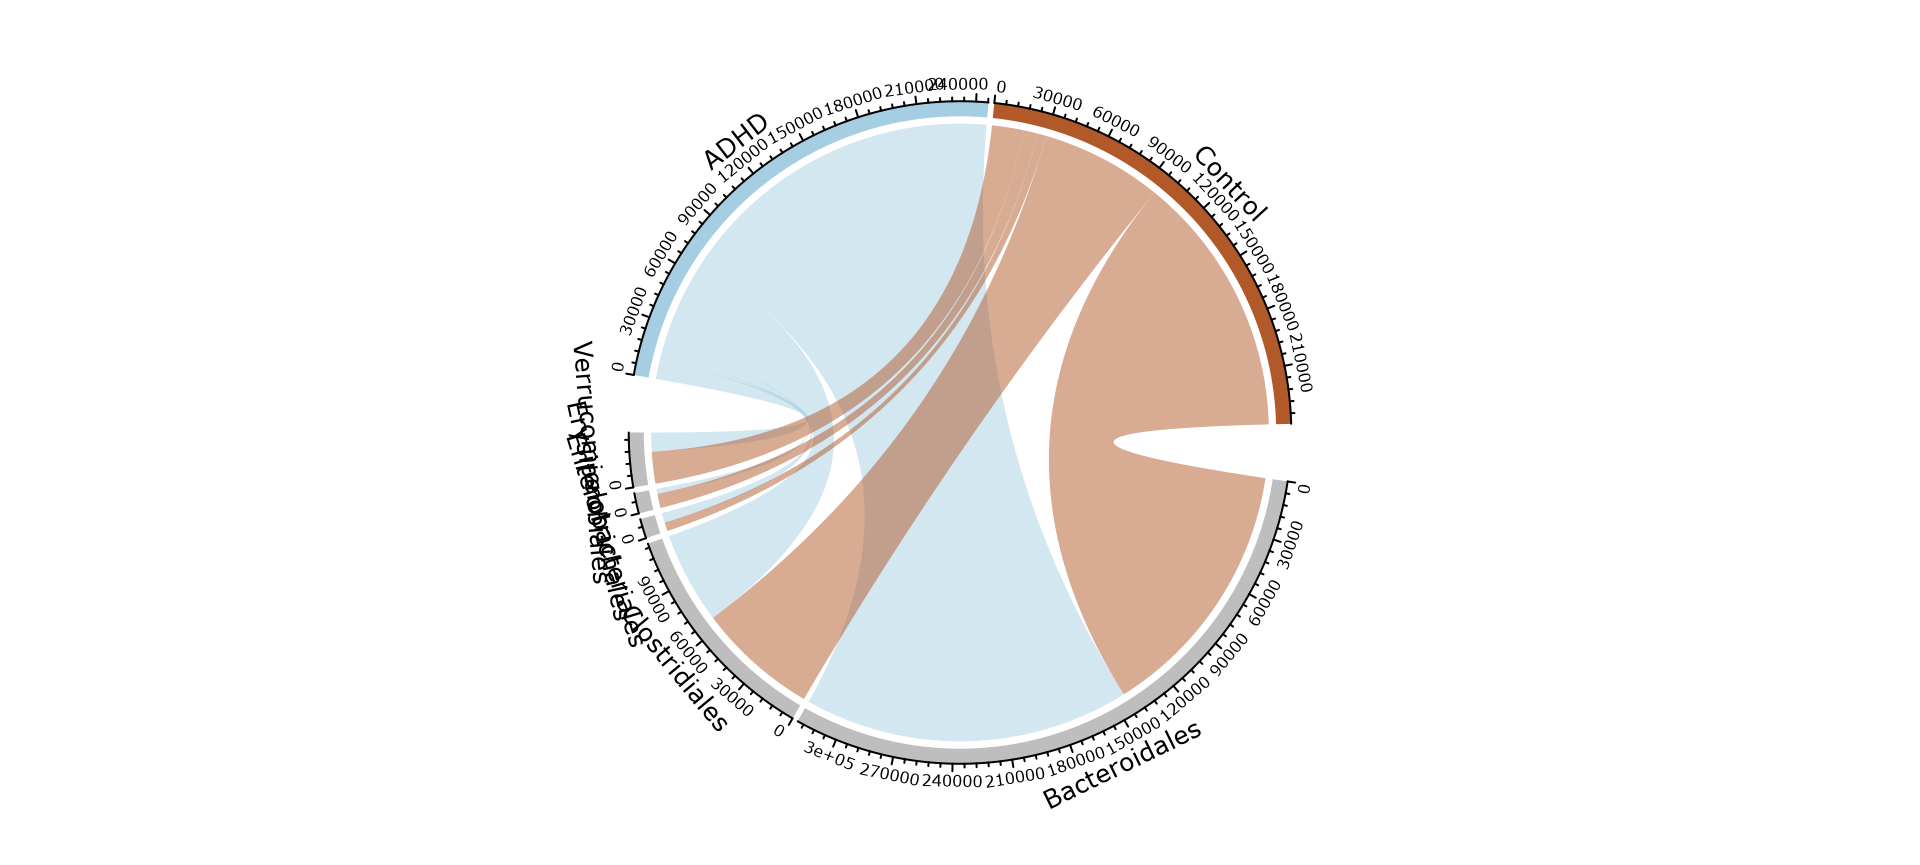
upset_pq(ten, "patient_status_vs_cohort")
#> Warning: Using `size` aesthetic for lines was deprecated in ggplot2 3.4.0.
#> ℹ Please use `linewidth` instead.
#> ℹ The deprecated feature was likely used in the ComplexUpset package.
#>   Please report the issue at
#>   <https://github.com/krassowski/complex-upset/issues>.
#> This warning is displayed once per session.
#> Call `lifecycle::last_lifecycle_warnings()` to see where this warning was
#> generated.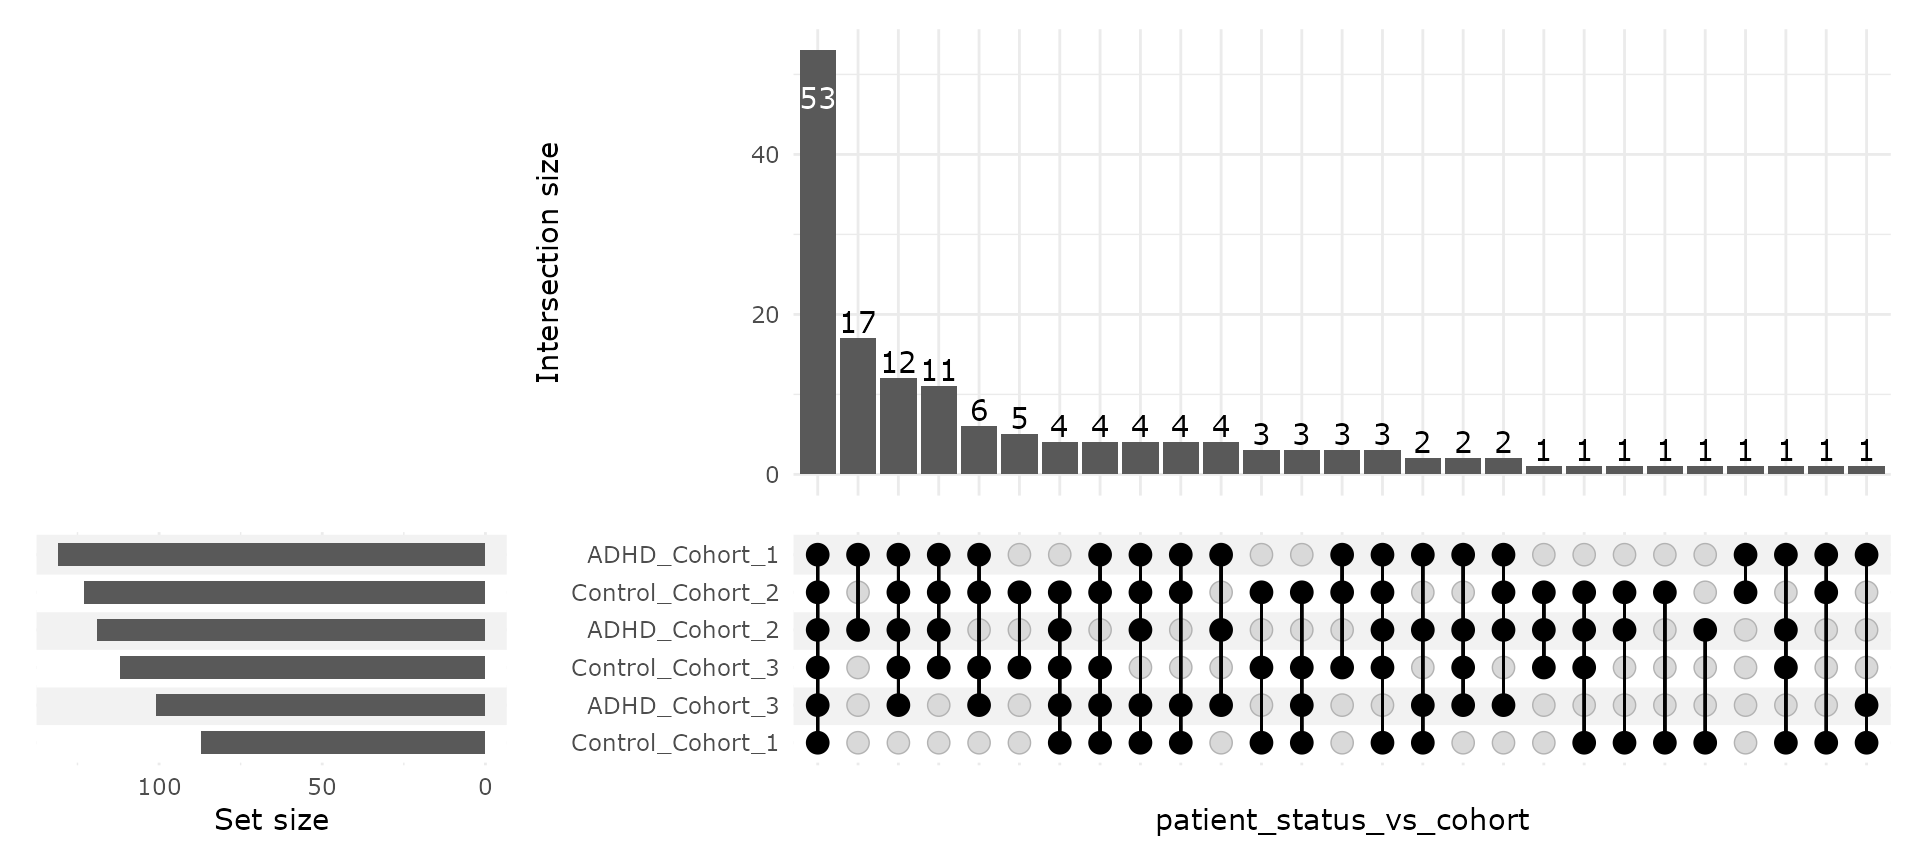
ggvenn_pq(clean_pq(ten, force_taxa_as_columns = TRUE),
  "cohort",
  rarefy_before_merging = TRUE
) +
  theme(legend.position = "none")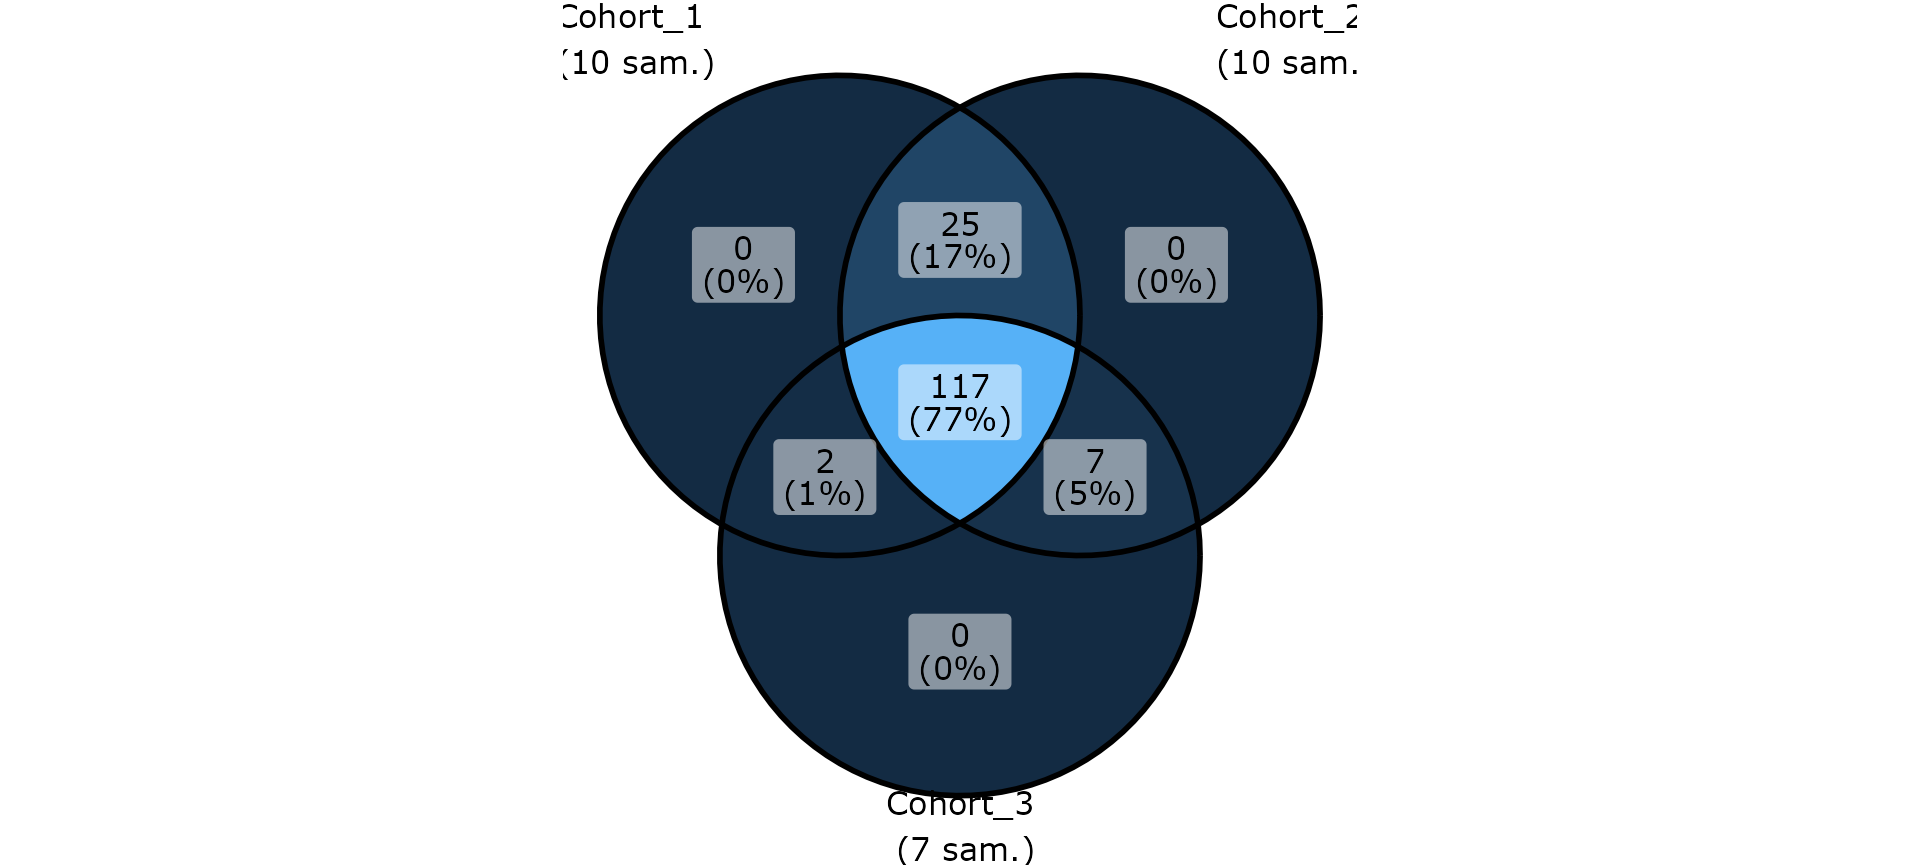
ten_control <- clean_pq(subset_samples(ten, patient_status == "Control"))
# p_control <- heat_tree_pq(
#   ten_control,
#   node_size = n_obs,
#   node_color = nb_sequences,
#   node_label = taxon_names,
#   tree_label = taxon_names,
#   node_size_trans = "log10 area"
# )

ten_ADHD <- clean_pq(subset_samples(ten, patient_status == "ADHD"))
# p_ADHD <- heat_tree_pq(
#   ten_ADHD,
#   node_size = n_obs,
#   node_color = nb_sequences,
#   node_label = taxon_names,
#   tree_label = taxon_names,
#   node_size_trans = "log10 area"
# )
#
# p_control + ggtitle("Control") + p_ADHD + ggtitle("ADHD")
knitr::kable(track_wkflow(list(
  "All samples" = ten,
  "Control samples" = ten_control,
  "ADHD samples" = ten_ADHD
)))| nb_sequences | nb_clusters | nb_samples | |
|---|---|---|---|
| All samples | 485932 | 151 | 27 |
| Control samples | 239329 | 130 | 14 |
| ADHD samples | 246603 | 142 | 13 |
adonis_pq(ten, "cohort + patient_status")
#> Permutation test for adonis under reduced model
#> Permutation: free
#> Number of permutations: 999
#>
#> vegan::adonis2(formula = .formula, data = metadata)
#>          Df SumOfSqs      R2      F Pr(>F)
#> Model     3   1.2425 0.18483 1.7383  0.028 *
#> Residual 23   5.4799 0.81517
#> Total    26   6.7223 1.00000
#> ---
#> Signif. codes:  0 '***' 0.001 '**' 0.01 '*' 0.05 '.' 0.1 ' ' 1
ten@tax_table <- phyloseq::tax_table(cbind(
ten@tax_table,
"Species" = taxa_names(ten)
))
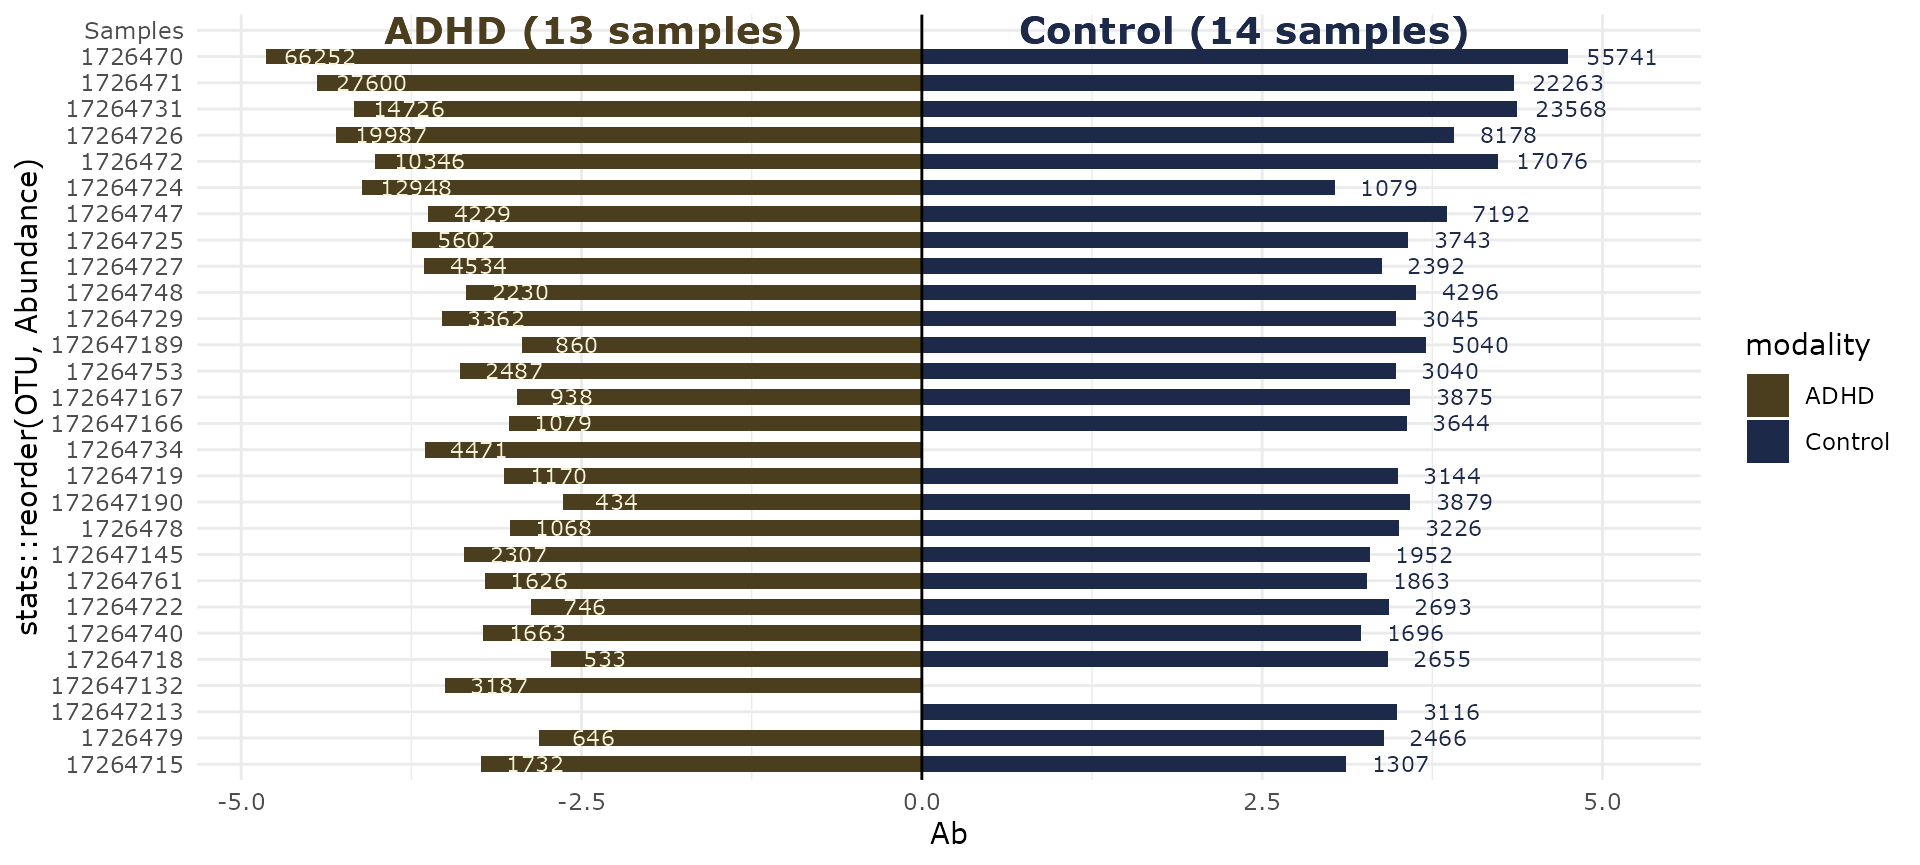
biplot_pq(subset_taxa_pq(ten, taxa_sums(ten) > 3000),
merge_sample_by = "patient_status",
fact = "patient_status",
nudge_y = 0.4
)
multitax_bar_pq(ten, "Phylum", "Class", "Order", "patient_status")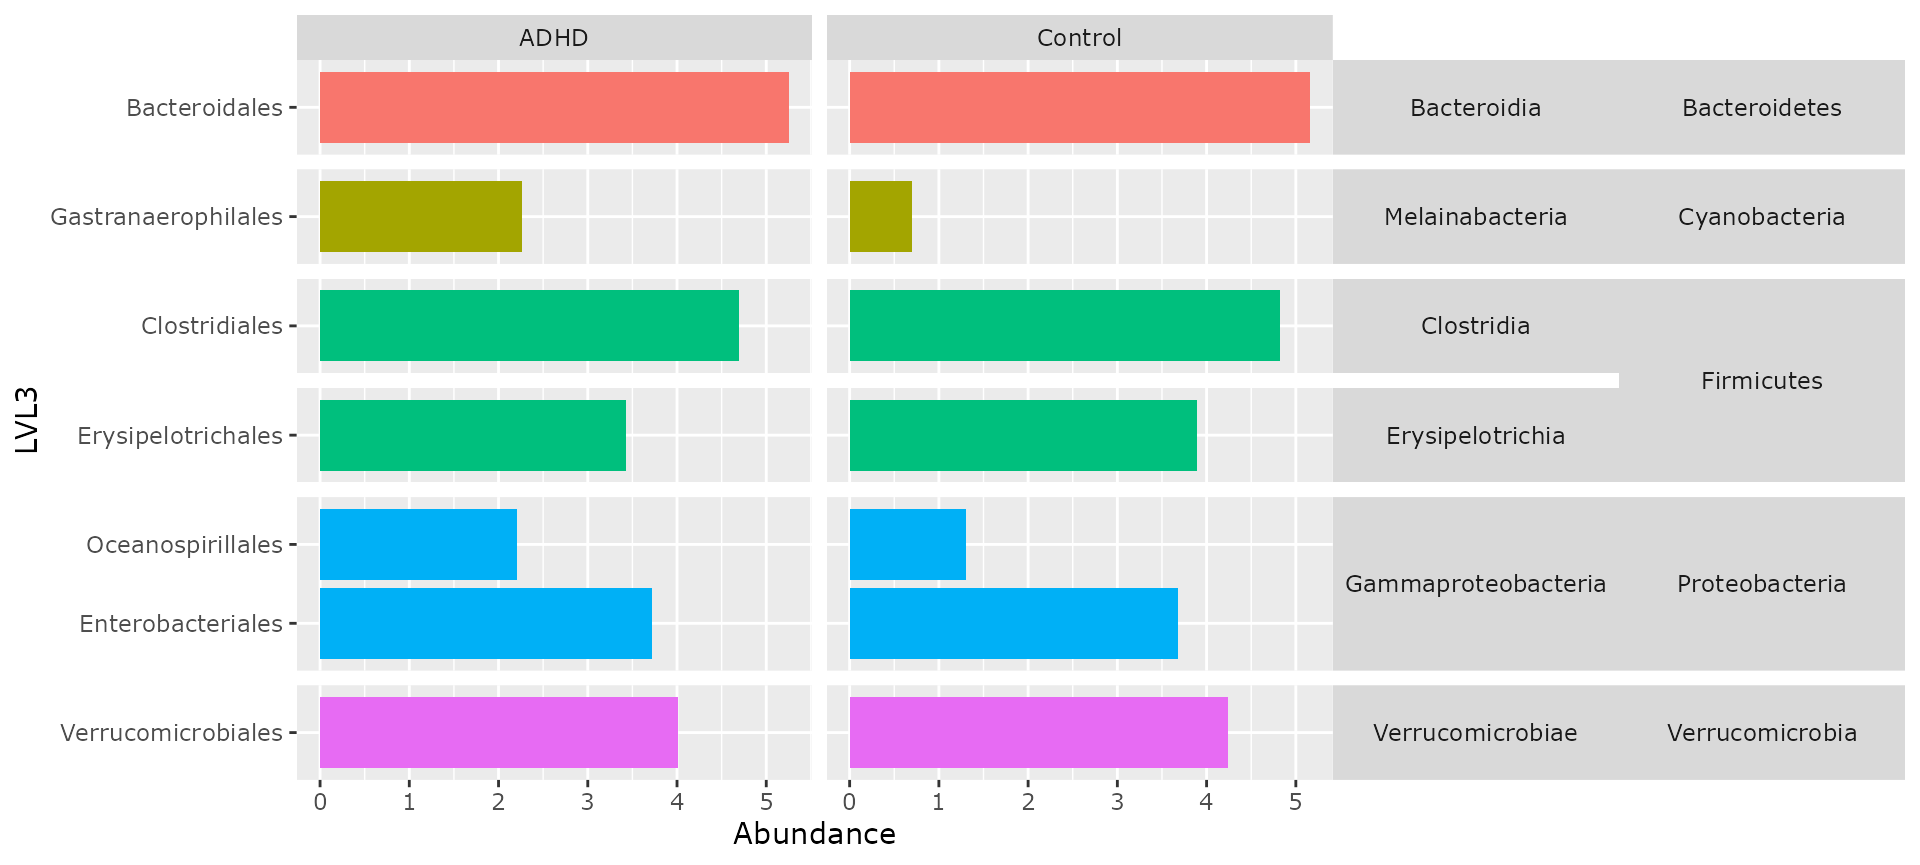
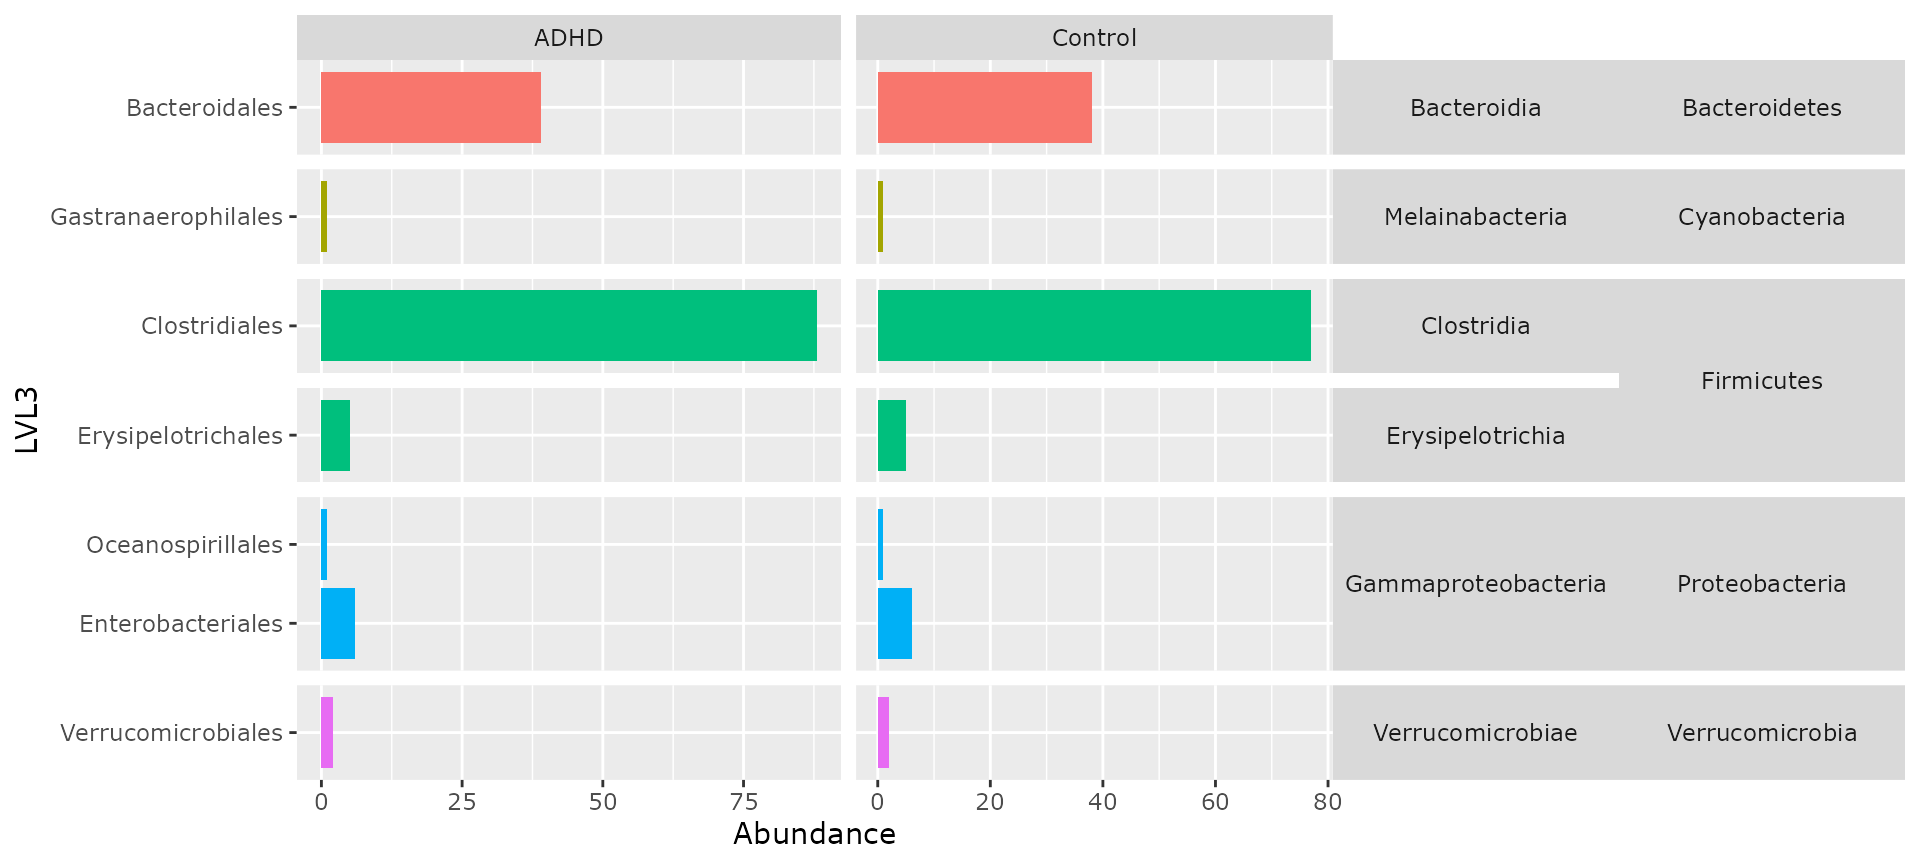
multitax_bar_pq(ten, "Phylum", "Class", "Order", "patient_status",
  nb_seq = FALSE, log10trans = FALSE
)
Differential abundance analysis
plot_deseq2_pq(ten,
  contrast = c("patient_status", "ADHD", "Control"),
  taxolev = "Genus"
)
#> Warning in DESeqDataSet(se, design = design, ignoreRank): some variables in
#> design formula are characters, converting to factors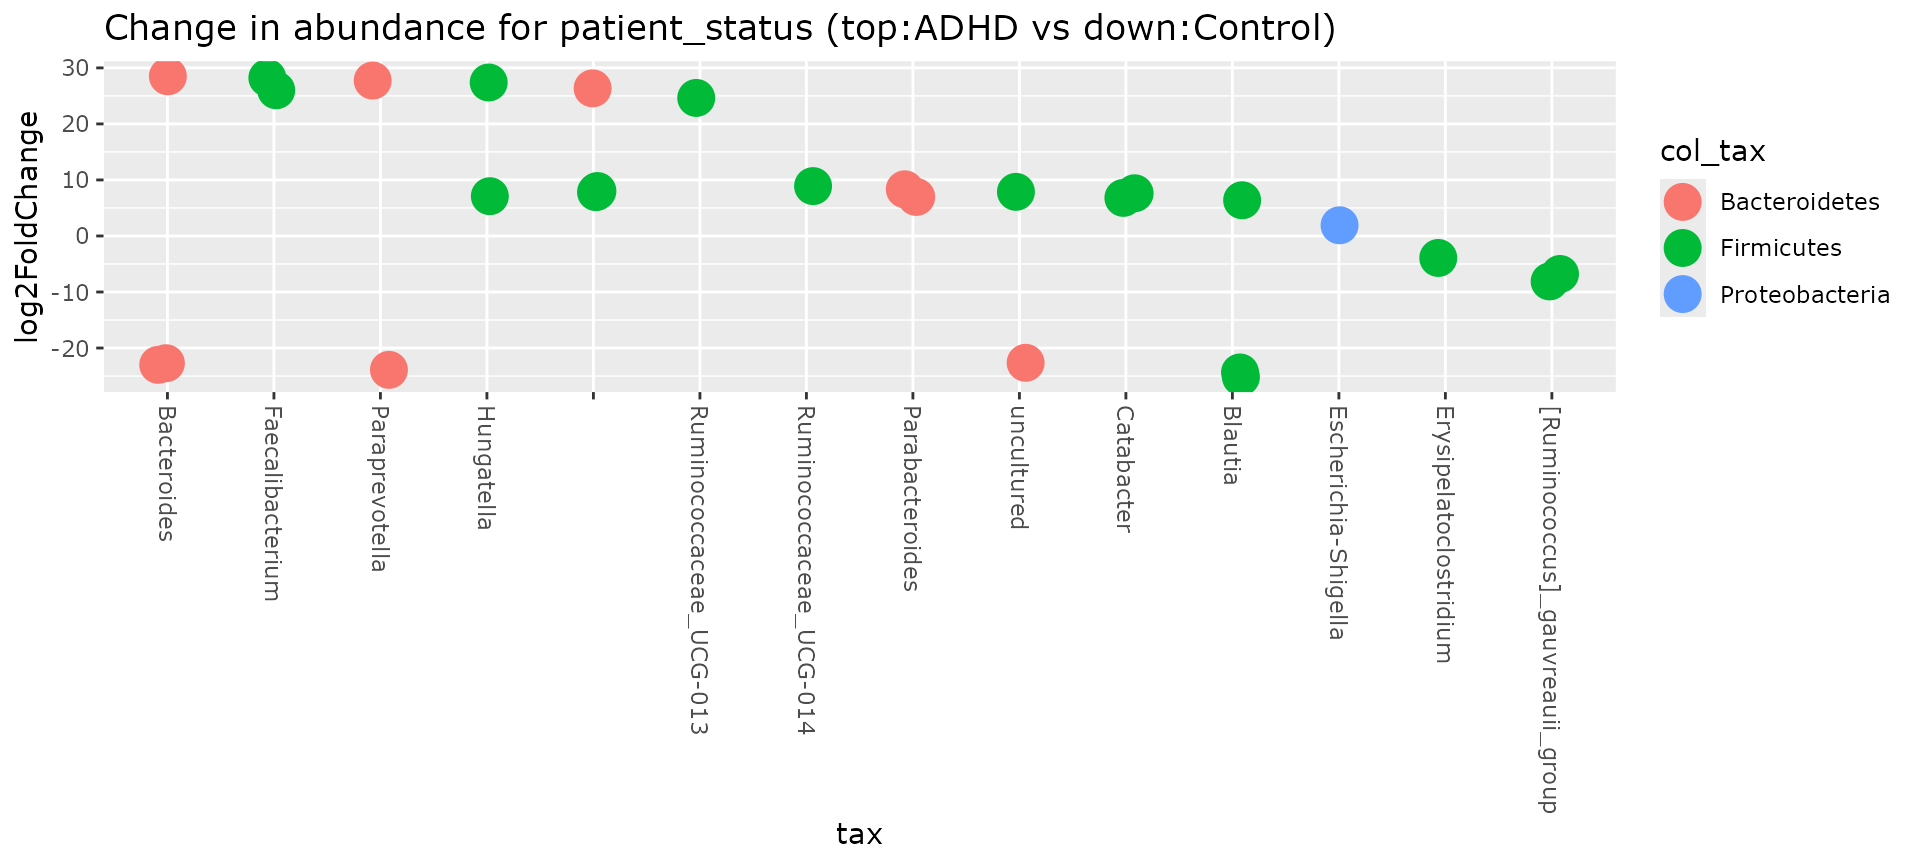
LEfSe <- diff_analysis(
  ten,
  classgroup = "patient_status",
  mlfun = "lda",
  ldascore = 2,
  p.adjust.methods = "bh"
)
library(ggplot2)
ggeffectsize(LEfSe) +
  scale_color_manual(values = c(
    "#00AED7",
    "#FD9347"
  )) +
  theme_bw()
#> Warning: `aes_()` was deprecated in ggplot2 3.0.0.
#> ℹ Please use tidy evaluation idioms with `aes()`
#> ℹ The deprecated feature was likely used in the MicrobiotaProcess package.
#>   Please report the issue at
#>   <https://github.com/YuLab-SMU/MicrobiotaProcess/issues>.
#> This warning is displayed once per session.
#> Call `lifecycle::last_lifecycle_warnings()` to see where this warning was
#> generated.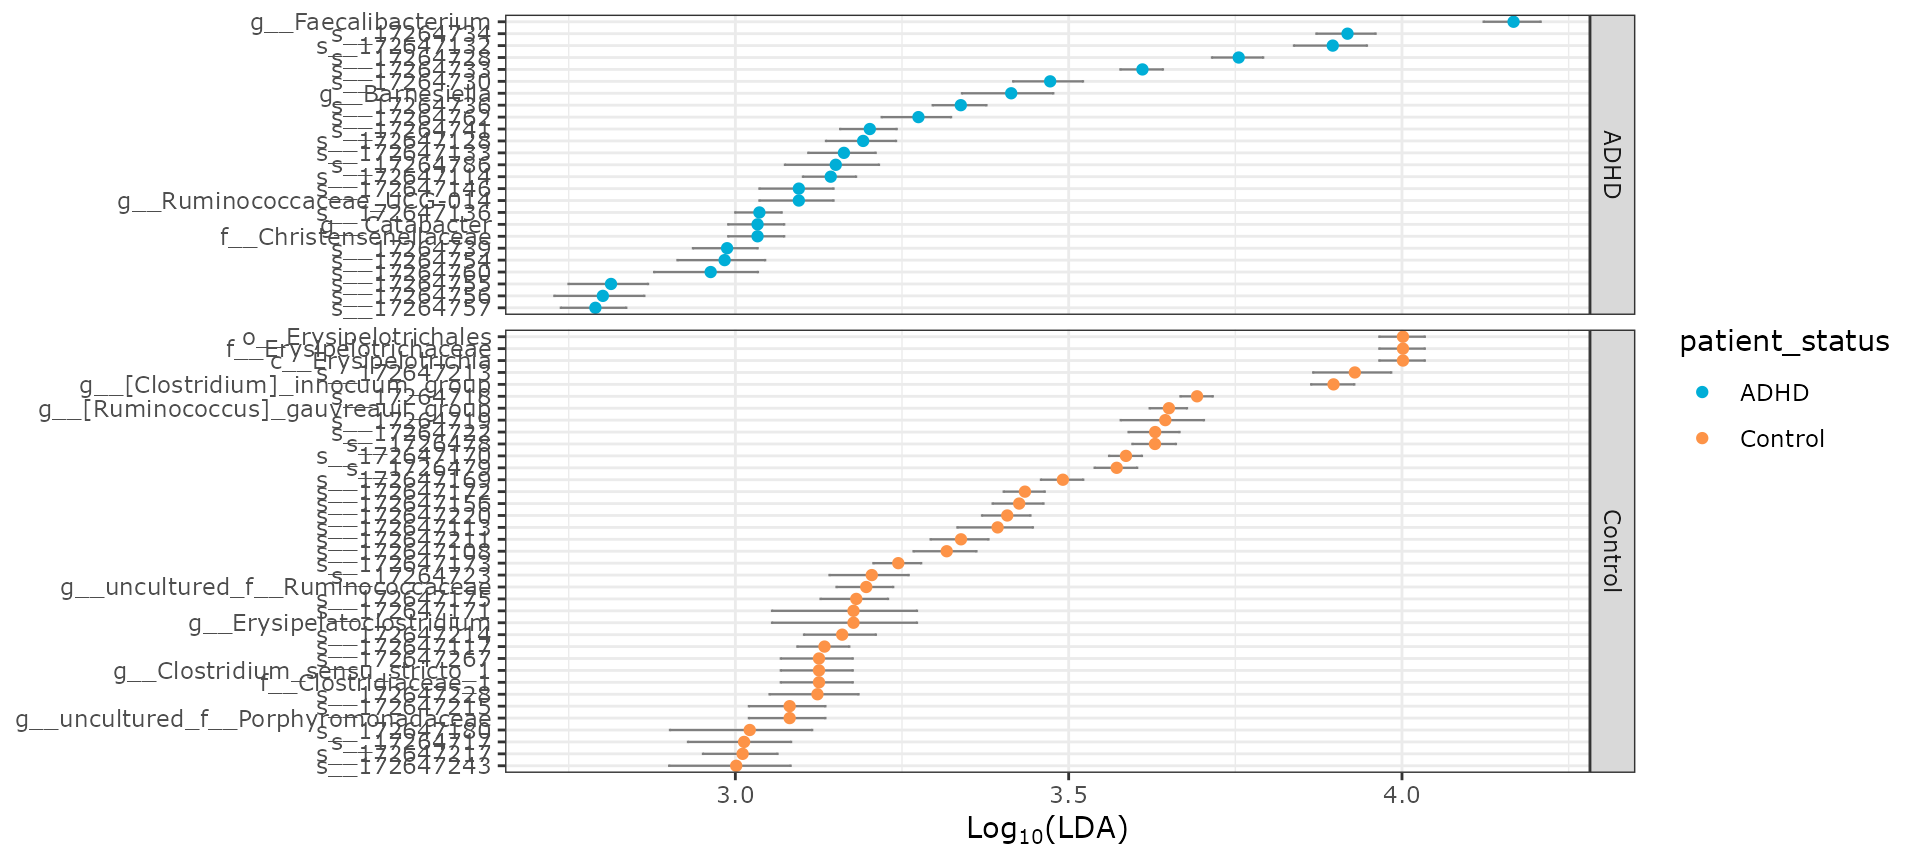
Session information
sessionInfo()
#> R version 4.5.2 (2025-10-31)
#> Platform: x86_64-pc-linux-gnu
#> Running under: Pop!_OS 24.04 LTS
#>
#> Matrix products: default
#> BLAS:   /usr/lib/x86_64-linux-gnu/blas/libblas.so.3.12.0
#> LAPACK: /usr/lib/x86_64-linux-gnu/lapack/liblapack.so.3.12.0  LAPACK version 3.12.0
#>
#> locale:
#>  [1] LC_CTYPE=en_US.UTF-8       LC_NUMERIC=C
#>  [3] LC_TIME=en_US.UTF-8        LC_COLLATE=en_US.UTF-8
#>  [5] LC_MONETARY=en_US.UTF-8    LC_MESSAGES=en_US.UTF-8
#>  [7] LC_PAPER=en_US.UTF-8       LC_NAME=C
#>  [9] LC_ADDRESS=C               LC_TELEPHONE=C
#> [11] LC_MEASUREMENT=en_US.UTF-8 LC_IDENTIFICATION=C
#>
#> time zone: Europe/Paris
#> tzcode source: system (glibc)
#>
#> attached base packages:
#> [1] stats     graphics  grDevices utils     datasets  methods   base
#>
#> other attached packages:
#>  [1] iNEXT_3.0.2              patchwork_1.3.2          MiscMetabar_0.15.2
#>  [4] divent_0.5-3             purrr_1.2.2              dplyr_1.2.1
#>  [7] dada2_1.38.0             Rcpp_1.1.1               ggplot2_4.0.2
#> [10] phyloseq_1.54.2          MicrobiotaProcess_1.22.1
#>
#> loaded via a namespace (and not attached):
#>   [1] libcoin_1.0-12              RColorBrewer_1.1-3
#>   [3] shape_1.4.6.1               jsonlite_2.0.0
#>   [5] magrittr_2.0.5              TH.data_1.1-5
#>   [7] modeltools_0.2-24           farver_2.1.2
#>   [9] rmarkdown_2.31              GlobalOptions_0.1.4
#>  [11] fs_2.0.1                    ragg_1.5.2
#>  [13] vctrs_0.7.3                 multtest_2.66.0
#>  [15] Rsamtools_2.26.0            ggtree_4.0.5
#>  [17] htmltools_0.5.9             S4Arrays_1.10.1
#>  [19] ComplexUpset_1.3.3          Rhdf5lib_1.32.0
#>  [21] SparseArray_1.10.10         rhdf5_2.54.1
#>  [23] gridGraphics_0.5-1          sass_0.4.10
#>  [25] bslib_0.10.0                htmlwidgets_1.6.4
#>  [27] desc_1.4.3                  plyr_1.8.9
#>  [29] sandwich_3.1-1              zoo_1.8-15
#>  [31] cachem_1.1.0                ggfittext_0.10.3
#>  [33] GenomicAlignments_1.46.0    igraph_2.2.3
#>  [35] lifecycle_1.0.5             iterators_1.0.14
#>  [37] pkgconfig_2.0.3             Matrix_1.7-4
#>  [39] R6_2.6.1                    fastmap_1.2.0
#>  [41] rbibutils_2.4.1             MatrixGenerics_1.22.0
#>  [43] digest_0.6.39               aplot_0.2.9
#>  [45] colorspace_2.1-2            ggnewscale_0.5.2
#>  [47] ShortRead_1.68.0            S4Vectors_0.48.1
#>  [49] DESeq2_1.50.2               textshaping_1.0.5
#>  [51] GenomicRanges_1.62.1        hwriter_1.3.2.1
#>  [53] vegan_2.7-3                 labeling_0.4.3
#>  [55] abind_1.4-8                 mgcv_1.9-4
#>  [57] compiler_4.5.2              fontquiver_0.2.1
#>  [59] withr_3.0.2                 S7_0.2.1
#>  [61] BiocParallel_1.44.0         ggsignif_0.6.4
#>  [63] MASS_7.3-65                 rappdirs_0.3.4
#>  [65] DelayedArray_0.36.1         biomformat_1.38.3
#>  [67] permute_0.9-10              tools_4.5.2
#>  [69] otel_0.2.0                  ape_5.8-1
#>  [71] glue_1.8.0                  treemapify_2.6.0
#>  [73] nlme_3.1-168                rhdf5filters_1.22.0
#>  [75] grid_4.5.2                  cluster_2.1.8.2
#>  [77] reshape2_1.4.5              ade4_1.7-24
#>  [79] generics_0.1.4              gtable_0.3.6
#>  [81] tidyr_1.3.2                 ggVennDiagram_1.5.7
#>  [83] data.table_1.18.2.1         coin_1.4-3
#>  [85] XVector_0.50.0              BiocGenerics_0.56.0
#>  [87] ggrepel_0.9.8               foreach_1.5.2
#>  [89] pillar_1.11.1               stringr_1.6.0
#>  [91] yulab.utils_0.2.4           circlize_0.4.18
#>  [93] splines_4.5.2               treeio_1.34.0
#>  [95] lattice_0.22-9              deldir_2.0-4
#>  [97] survival_3.8-6              tidyselect_1.2.1
#>  [99] locfit_1.5-9.12             fontLiberation_0.1.0
#> [101] pbapply_1.7-4               Biostrings_2.78.0
#> [103] knitr_1.51                  fontBitstreamVera_0.1.1
#> [105] gridExtra_2.3               IRanges_2.44.0
#> [107] Seqinfo_1.0.0               SummarizedExperiment_1.40.0
#> [109] svglite_2.2.2               ggtreeExtra_1.21.0
#> [111] stats4_4.5.2                xfun_0.57
#> [113] Biobase_2.70.0              matrixStats_1.5.0
#> [115] stringi_1.8.7               lazyeval_0.2.3
#> [117] ggfun_0.2.0                 yaml_2.3.12
#> [119] evaluate_1.0.5              codetools_0.2-20
#> [121] cigarillo_1.0.0             interp_1.1-6
#> [123] gdtools_0.5.0               tibble_3.3.1
#> [125] ggplotify_0.1.3             cli_3.6.6
#> [127] RcppParallel_5.1.11-2       Rdpack_2.6.6
#> [129] systemfonts_1.3.2           jquerylib_0.1.4
#> [131] png_0.1-9                   parallel_4.5.2
#> [133] ggh4x_0.3.1                 pkgdown_2.2.0
#> [135] jpeg_0.1-11                 latticeExtra_0.6-31
#> [137] bitops_1.0-9                ggstar_1.0.6
#> [139] pwalign_1.6.0               mvtnorm_1.3-6
#> [141] tidytree_0.4.7              ggiraph_0.9.6
#> [143] scales_1.4.0                crayon_1.5.3
#> [145] rlang_1.2.0                 multcomp_1.4-30
References
Tengeler, A.C., Dam, S.A., Wiesmann, M. et al. Gut microbiota from persons with attention-deficit/hyperactivity disorder affects the brain in mice. Microbiome 8, 44 (2020). https://microbiomejournal.biomedcentral.com/articles/10.1186/s40168-020-00816-x