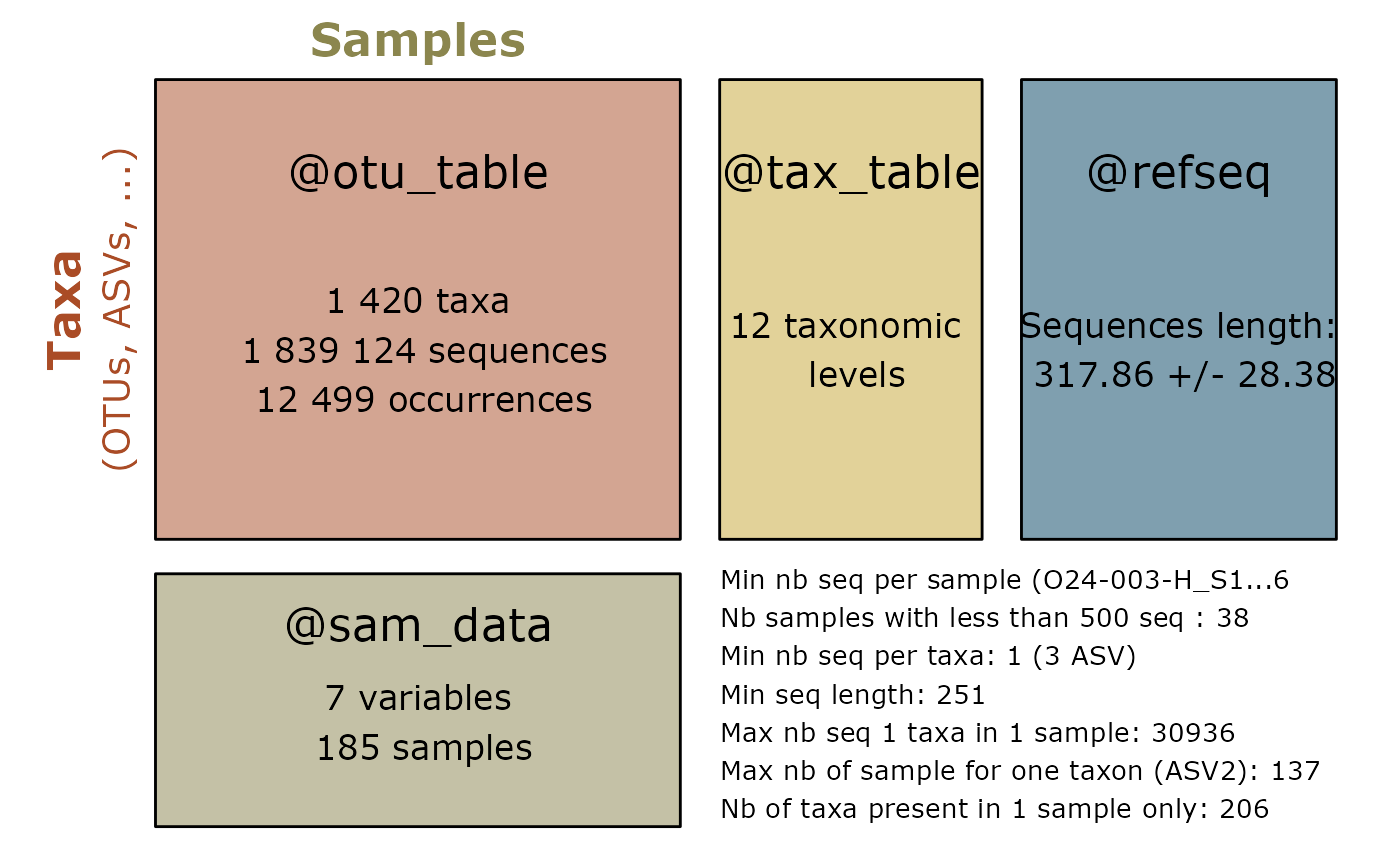
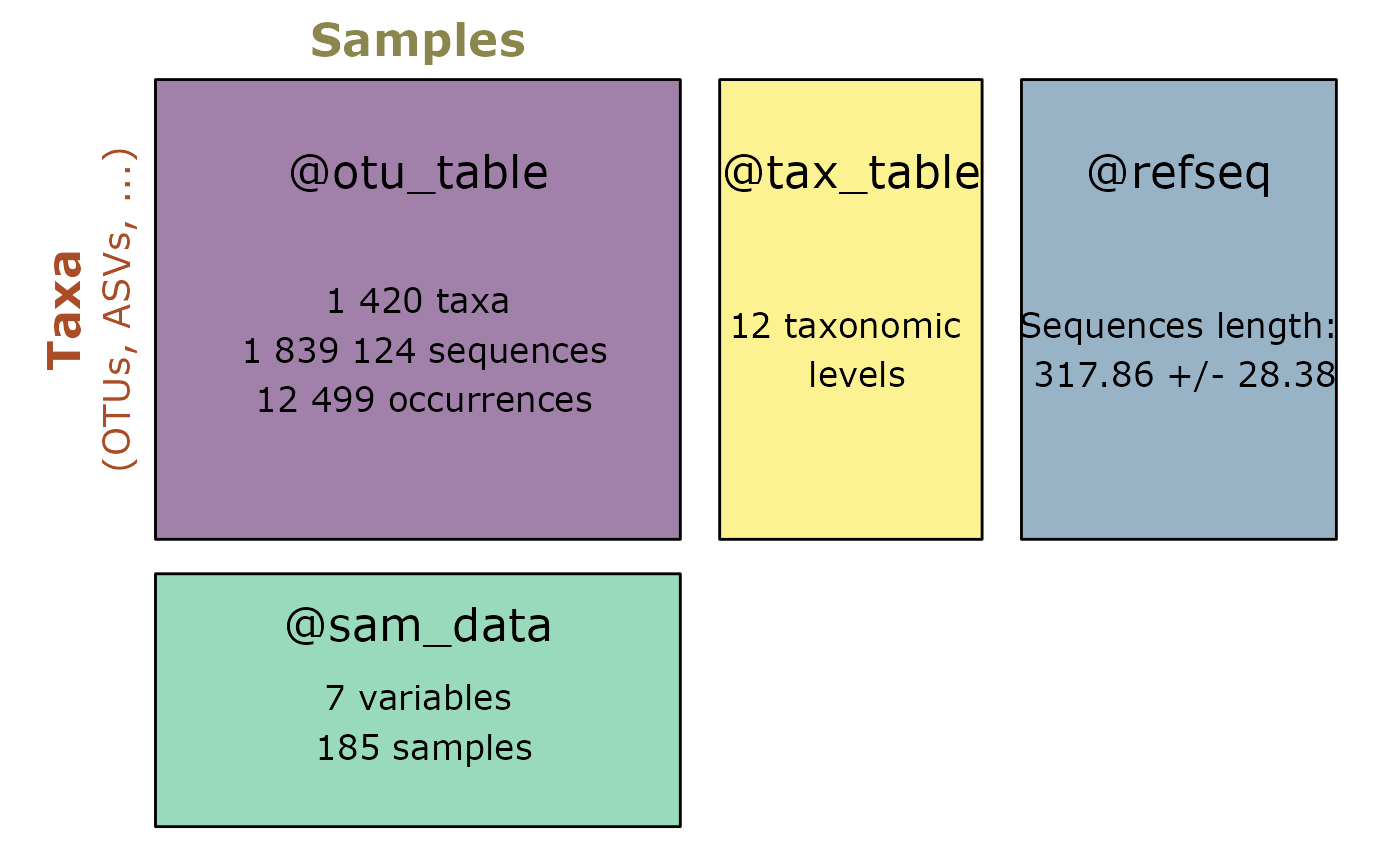
Graphical representation of a phyloseq object.
Usage
summary_plot_pq(
  physeq,
  add_info = TRUE,
  min_seq_samples = 500,
  clean_pq = TRUE,
  text_size = 1,
  text_size_info = 1
)
Arguments
- physeq
(required) a
phyloseq-classobject obtained using thephyloseqpackage.- add_info
Does the bottom down corner contain extra informations?
- min_seq_samples
(int): Used only when add_info is set to true to print the number of samples with less sequences than this number.
- clean_pq
(logical): Does the phyloseq object is cleaned using the
clean_pq()function?- text_size
(Num, default 1) A size factor to expand or minimize text size.
- text_size_info
(Num, default 1) A size factor to expand or minimize text size for extra informations.
Examples
summary_plot_pq(data_fungi_mini)
 summary_plot_pq(data_fungi_mini, add_info = FALSE) + scale_fill_viridis_d()
#> Scale for fill is already present.
#> Adding another scale for fill, which will replace the existing scale.
summary_plot_pq(data_fungi_mini, add_info = FALSE) + scale_fill_viridis_d()
#> Scale for fill is already present.
#> Adding another scale for fill, which will replace the existing scale.
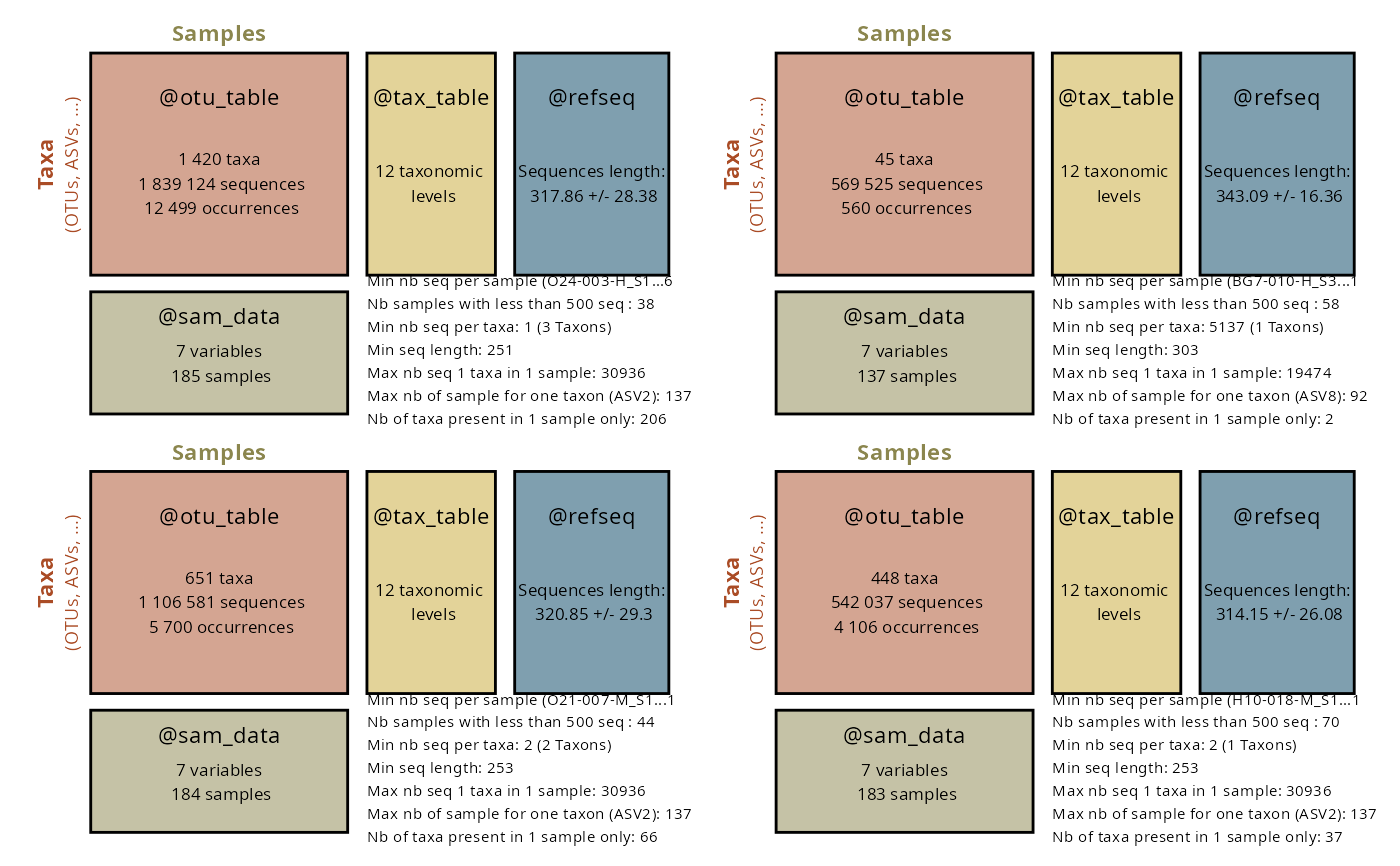
 # \donttest{
if (requireNamespace("patchwork")) {
(summary_plot_pq(data_fungi, text_size = 0.5, text_size_info = 0.6) +
summary_plot_pq(data_fungi_mini, text_size = 0.5, text_size_info = 0.6)) /
(summary_plot_pq(data_fungi_sp_known, text_size = 0.5, text_size_info = 0.6) +
summary_plot_pq(subset_taxa(data_fungi_sp_known, Phylum == "Ascomycota"),
text_size = 0.5, text_size_info = 0.6
))
}
#> Cleaning suppress 0 taxa and 1 samples.
#> Cleaning suppress 0 taxa and 2 samples.
# \donttest{
if (requireNamespace("patchwork")) {
(summary_plot_pq(data_fungi, text_size = 0.5, text_size_info = 0.6) +
summary_plot_pq(data_fungi_mini, text_size = 0.5, text_size_info = 0.6)) /
(summary_plot_pq(data_fungi_sp_known, text_size = 0.5, text_size_info = 0.6) +
summary_plot_pq(subset_taxa(data_fungi_sp_known, Phylum == "Ascomycota"),
text_size = 0.5, text_size_info = 0.6
))
}
#> Cleaning suppress 0 taxa and 1 samples.
#> Cleaning suppress 0 taxa and 2 samples.
 # }
# }