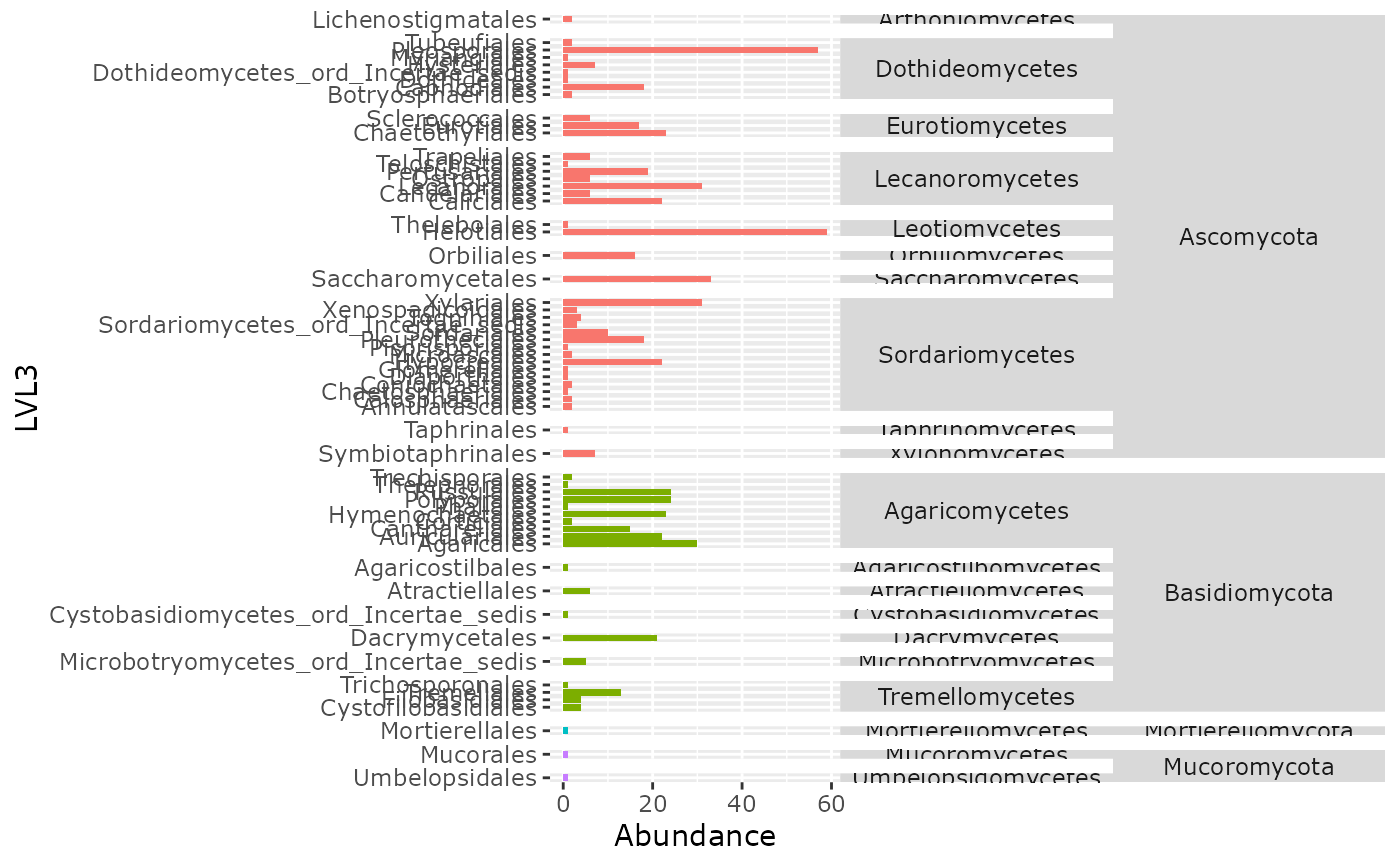
Plot taxonomic distribution across 3 taxonomic levels and optionally one sample factor
Source:R/plot_functions.R
multitax_bar_pq.Rd
Note that lvl3 need to be nested in lvl2 which need to be nested in lvl1
Arguments
- physeq
(required) a
phyloseq-classobject obtained using thephyloseqpackage.- lvl1
(required) Name of the first (higher) taxonomic rank of interest
- lvl2
(required) Name of the second (middle) taxonomic rank of interest
- lvl3
(required) Name of the first (lower) taxonomic rank of interest
- fact
Name of the factor to cluster samples by modalities. Need to be in
physeq@sam_data. If not set, the taxonomic distribution is plot for all samples together.- nb_seq
(logical; default TRUE) If set to FALSE, only the number of ASV is count. Concretely, physeq otu_table is transformed in a binary otu_table (each value different from zero is set to one)
- log10trans
(logical, default TRUE) If TRUE, the number of sequences (or ASV if nb_seq = FALSE) is log10 transformed.
Examples
# \donttest{
if (requireNamespace("ggh4x")) {
  multitax_bar_pq(data_fungi_sp_known, "Phylum", "Class", "Order", "Time")
  multitax_bar_pq(data_fungi_sp_known, "Phylum", "Class", "Order")
  multitax_bar_pq(data_fungi_sp_known, "Phylum", "Class", "Order",
    nb_seq = FALSE, log10trans = FALSE
  )
}
#> Loading required namespace: ggh4x

# }
# }