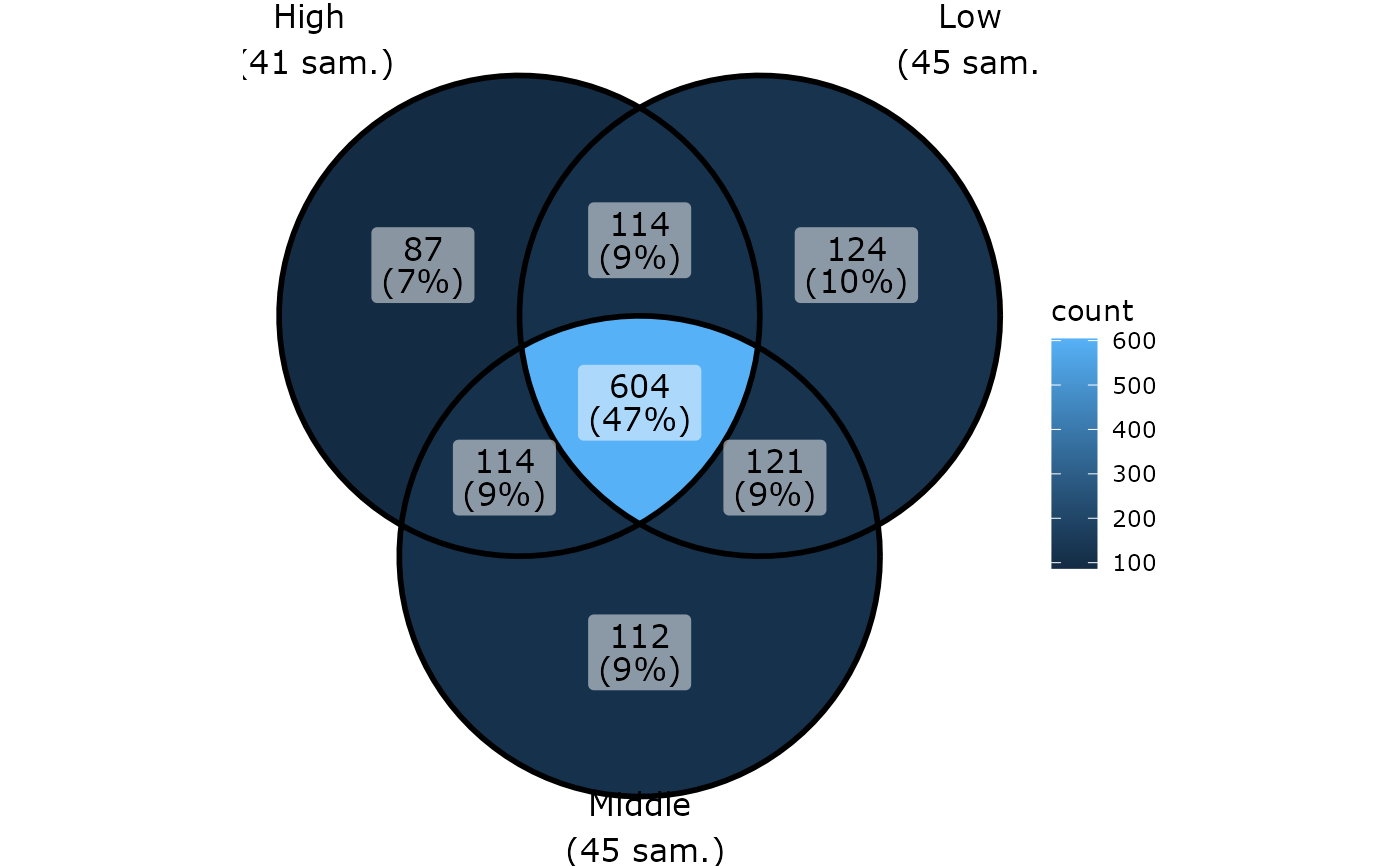
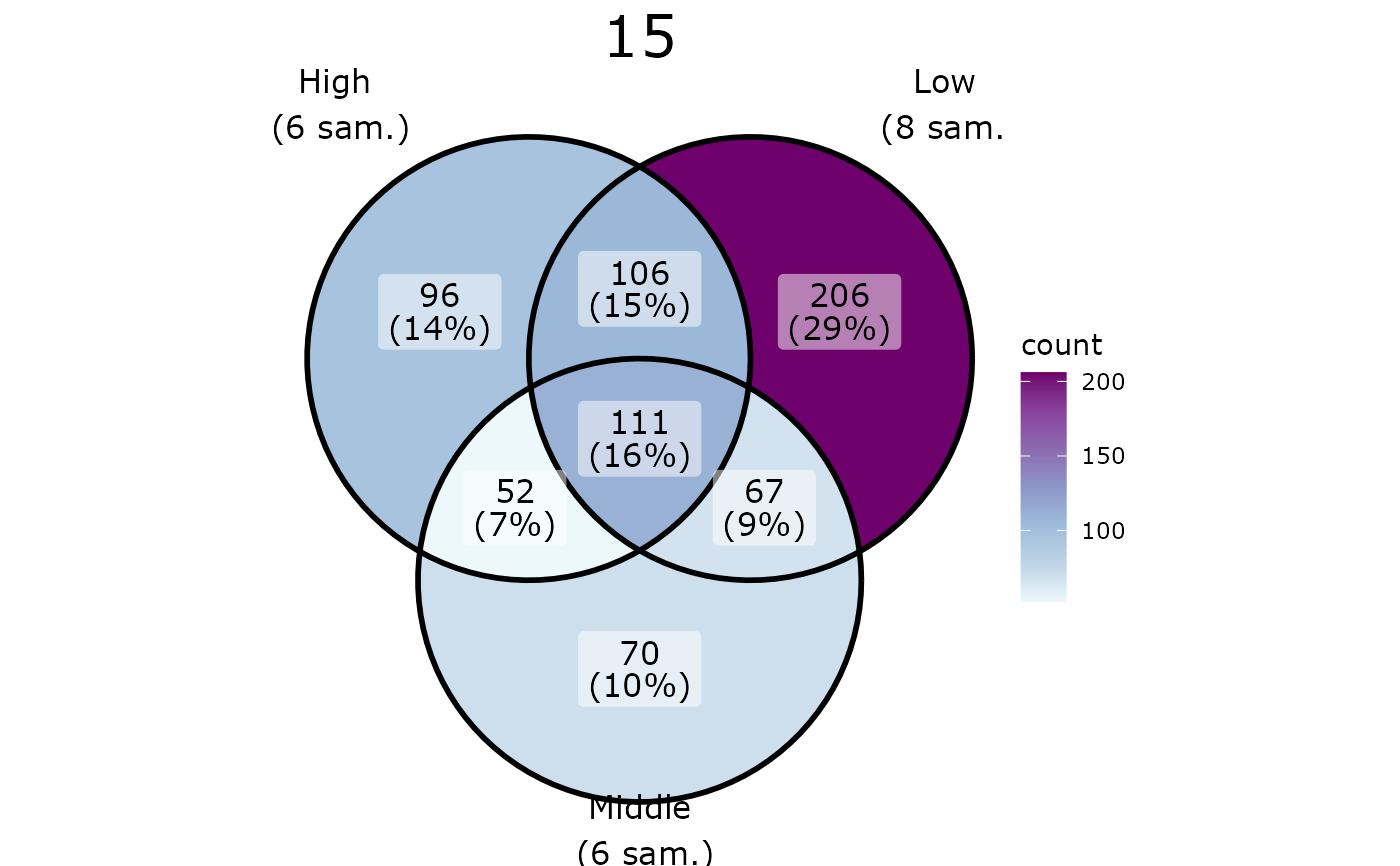
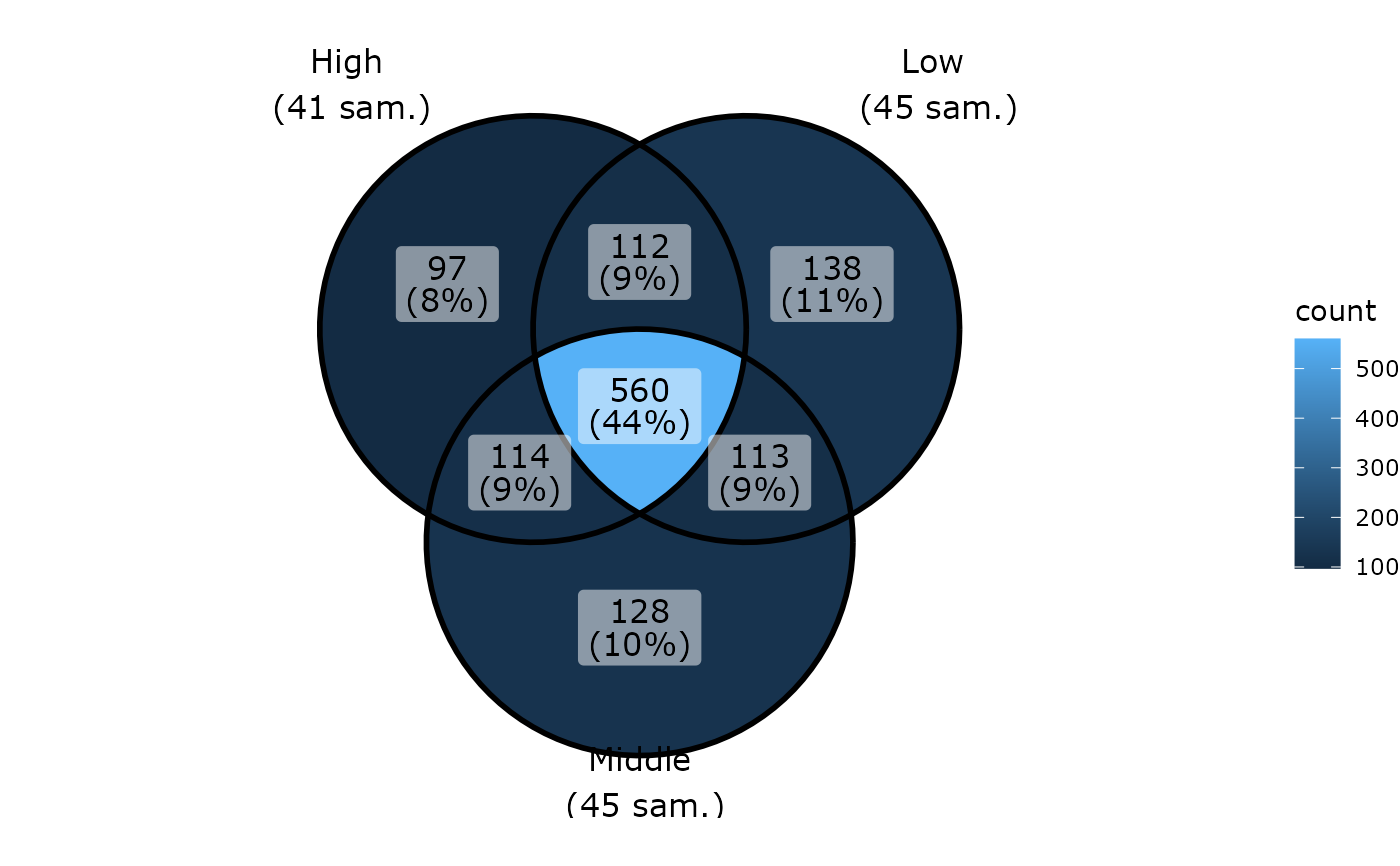
Venn diagram of phyloseq-class object using ggVennDiagram::ggVennDiagram function
Source: R/plot_functions.R
ggvenn_pq.Rd
Note that you can use ggplot2 function to customize the plot
for ex. + scale_fill_distiller(palette = "BuPu", direction = 1)
and + scale_x_continuous(expand = expansion(mult = 0.5)). See
examples.
Usage
ggvenn_pq(
  physeq = NULL,
  fact = NULL,
  min_nb_seq = 0,
  taxonomic_rank = NULL,
  split_by = NULL,
  add_nb_samples = TRUE,
  add_nb_seq = FALSE,
  rarefy_before_merging = FALSE,
  rarefy_after_merging = FALSE,
  rngseed = FALSE,
  return_data_for_venn = FALSE,
  verbose = TRUE,
  type = "nb_taxa",
  na_remove = TRUE,
  ...
)
Arguments
- physeq
(required) a
phyloseq-classobject obtained using thephyloseqpackage.- fact
(required) Name of the factor to cluster samples by modalities. Need to be in
physeq@sam_data.- min_nb_seq
minimum number of sequences by OTUs by samples to take into count this OTUs in this sample. For example, if min_nb_seq=2,each value of 2 or less in the OTU table will not count in the venn diagram
- taxonomic_rank
Name (or number) of a taxonomic rank to count. If set to Null (the default) the number of OTUs is counted.
- split_by
Split into multiple plot using variable split_by. The name of a variable must be present in
sam_dataslot of the physeq object.- add_nb_samples
(logical, default TRUE) Add the number of samples to levels names
- add_nb_seq
(logical, default FALSE) Add the number of sequences to levels names
- rarefy_before_merging
Rarefy each sample before merging by the modalities of args
fact. Usephyloseq::rarefy_even_depth()function- rarefy_after_merging
Rarefy each sample after merging by the modalities of args
fact.- rngseed
(Optional). A single integer value passed to
phyloseq::rarefy_even_depth(), which is used to fix a seed for reproducibly random number generation (in this case, reproducibly random subsampling). If set to FALSE, then no fiddling with the RNG seed is performed, and it is up to the user to appropriately call set.seed beforehand to achieve reproducible results. Default is FALSE.- return_data_for_venn
(logical, default FALSE) If TRUE, the plot is not returned, but the resulting dataframe to plot with ggVennDiagram package is returned.
- verbose
(logical, default TRUE) If TRUE, prompt some messages.
- type
If "nb_taxa" (default), the number of taxa (ASV, OTU or taxonomic_rank if
taxonomic_rankis not NULL) is used in plot. If "nb_seq", the number of sequences is plotted.taxonomic_rankis never used if type = "nb_seq".- na_remove
(logical, default TRUE) If set to TRUE, remove samples with NA in the variables set in
factparam- ...
Other arguments for the
ggVennDiagram::ggVennDiagramfunction for ex.category.names.
Value
A ggplot2 plot representing Venn diagram of
modalities of the argument factor or if split_by is set a list
of plots.
Examples
if (requireNamespace("ggVennDiagram")) {
ggvenn_pq(data_fungi_mini, fact = "Height")
}
#> 47 were discarded due to NA in variable fact
#> Taxa are now in columns.
#> Cleaning suppress 11 taxa and 0 samples.
#> Cleaning suppress 11 taxa and 0 samples.
#> Cleaning suppress 11 taxa and 0 samples.
 # \donttest{
if (requireNamespace("ggVennDiagram")) {
ggvenn_pq(data_fungi_mini, fact = "Height") +
ggplot2::scale_fill_distiller(palette = "BuPu", direction = 1)
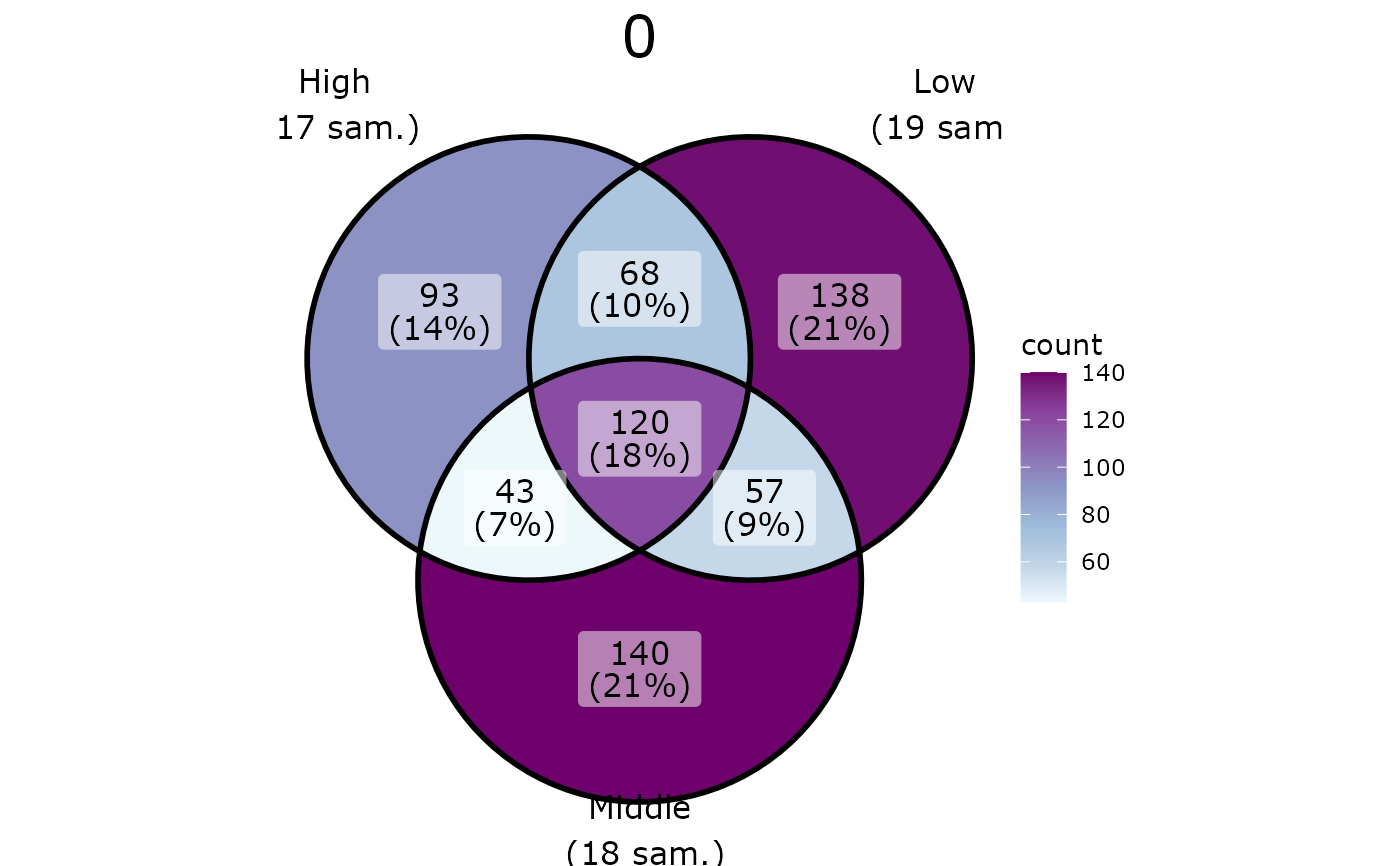
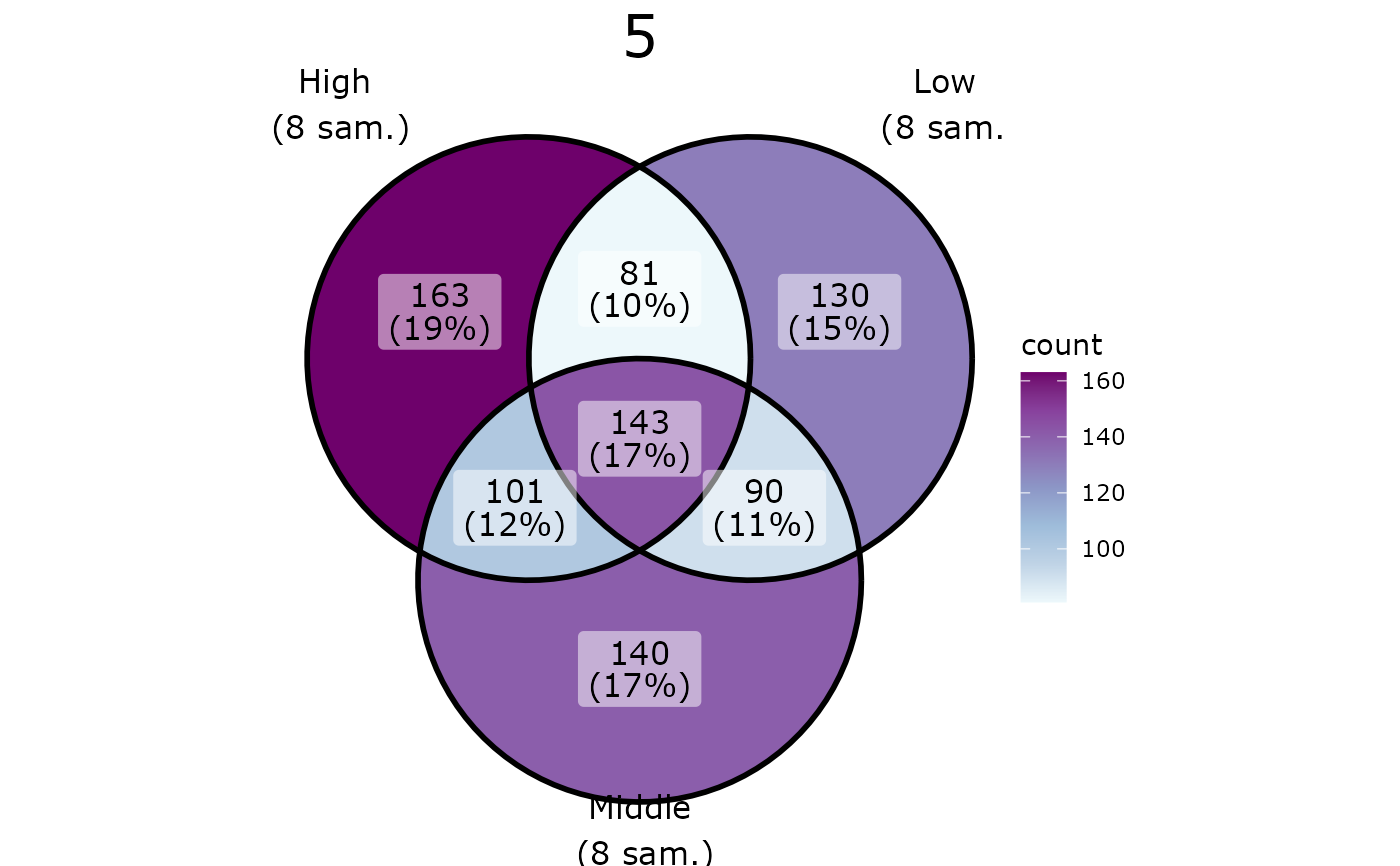
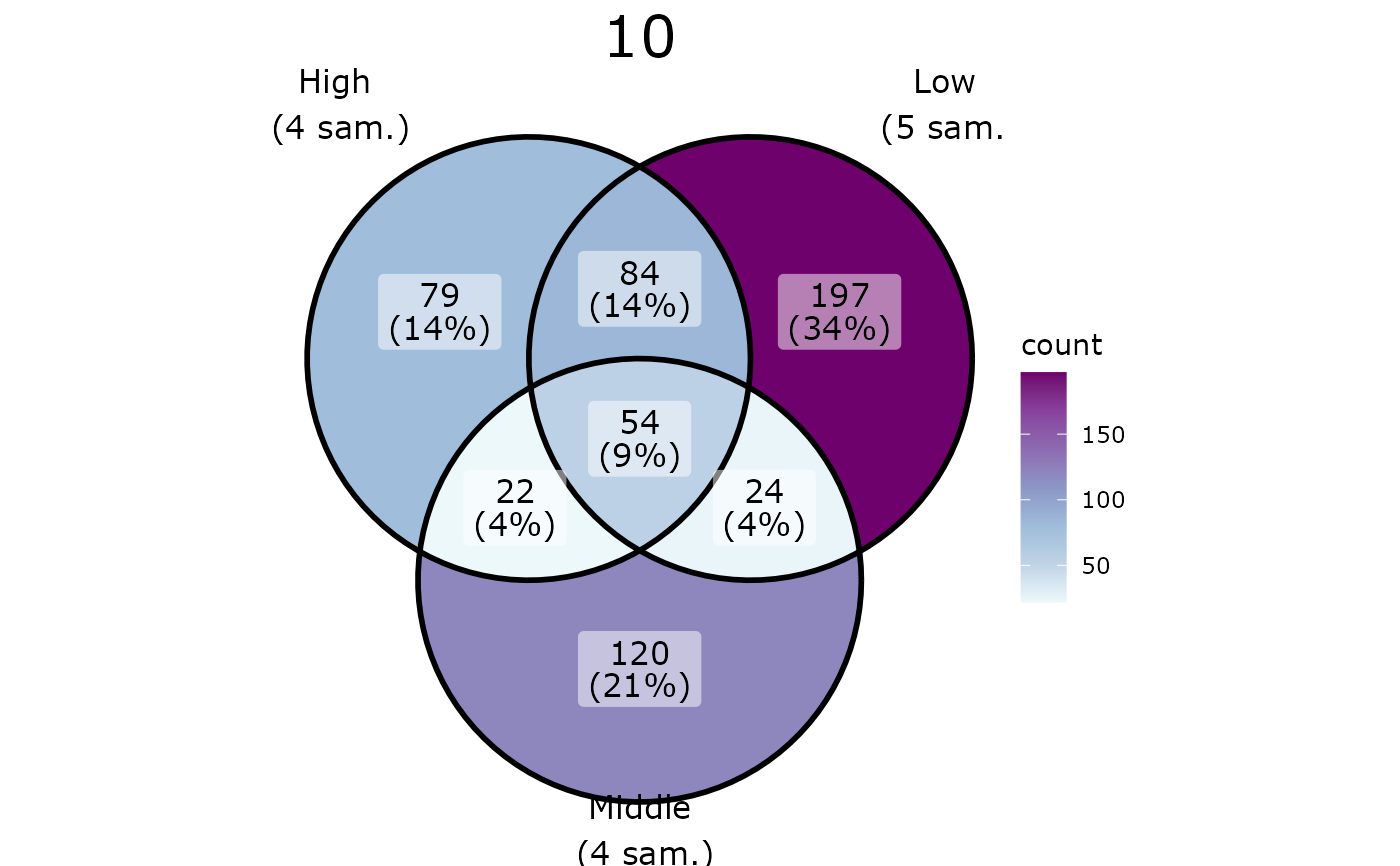
pl <- ggvenn_pq(data_fungi_mini, fact = "Height", split_by = "Time")
for (i in seq_along(pl)) {
p <- pl[[i]] +
scale_fill_distiller(palette = "BuPu", direction = 1) +
theme(plot.title = element_text(hjust = 0.5, size = 22))
print(p)
}
data_fungi2 <- subset_samples(
data_fungi_mini,
data_fungi_mini@sam_data$Tree_name == "A10-005" |
data_fungi_mini@sam_data$Height %in% c("Low", "High")
)
ggvenn_pq(data_fungi2, fact = "Height")
ggvenn_pq(data_fungi2, fact = "Height", type = "nb_seq")
ggvenn_pq(data_fungi_mini, fact = "Height", add_nb_seq = TRUE, set_size = 4)
ggvenn_pq(data_fungi_mini, fact = "Height", rarefy_before_merging = TRUE)
ggvenn_pq(data_fungi_mini, fact = "Height", rarefy_after_merging = TRUE) +
scale_x_continuous(expand = expansion(mult = 0.5))
# For more flexibility, you can save the dataset for more precise construction
# with ggplot2 and ggVennDiagramm
# (https://gaospecial.github.io/ggVennDiagram/articles/fully-customed.html)
res_venn <- ggvenn_pq(data_fungi_mini,
fact = "Height",
return_data_for_venn = TRUE
)
ggplot() +
# 1. region count layer
geom_polygon(aes(X, Y, group = id, fill = name),
data = ggVennDiagram::venn_regionedge(res_venn)
) +
scale_fill_manual(values = funky_color(7)) +
# 2. set edge layer
geom_path(aes(X, Y, color = id, group = id),
data = ggVennDiagram::venn_setedge(res_venn),
show.legend = FALSE, linewidth = 2
) +
scale_color_manual(values = c("red", "red", "blue")) +
# 3. set label layer
geom_text(aes(X, Y, label = name),
data = ggVennDiagram::venn_setlabel(res_venn)
) +
# 4. region label layer
geom_label(
aes(X, Y, label = paste0(
count, " (",
scales::percent(count / sum(count), accuracy = 2), ")"
)),
data = ggVennDiagram::venn_regionlabel(res_venn)
) +
theme_void()
}
#> 47 were discarded due to NA in variable fact
#> Taxa are now in columns.
#> Cleaning suppress 11 taxa and 0 samples.
#> Cleaning suppress 11 taxa and 0 samples.
#> Cleaning suppress 11 taxa and 0 samples.
#> 47 were discarded due to NA in variable fact
#> Taxa are now in columns.
#> Cleaning suppress 11 taxa and 0 samples.
#> Cleaning suppress 11 taxa and 0 samples.
#> Cleaning suppress 11 taxa and 0 samples.
#> Cleaning suppress 10 taxa and 0 samples.
#> Cleaning suppress 6 taxa and 0 samples.
#> Cleaning suppress 9 taxa and 0 samples.
#> Cleaning suppress 15 taxa and 0 samples.
#> Cleaning suppress 11 taxa and 0 samples.
#> Cleaning suppress 13 taxa and 0 samples.
#> Two modalities differ greatly (more than x2) in their number of sequences (29085 vs 4489). You may be interested by the parameter rarefy_after_merging
#> Cleaning suppress 9 taxa and 0 samples.
#> Cleaning suppress 7 taxa and 0 samples.
#> Cleaning suppress 12 taxa and 0 samples.
#> Two modalities differ greatly (more than x2) in their number of sequences (13275 vs 5567). You may be interested by the parameter rarefy_after_merging
#> Cleaning suppress 6 taxa and 0 samples.
#> Cleaning suppress 5 taxa and 0 samples.
#> Cleaning suppress 6 taxa and 0 samples.
#> Two modalities differ greatly (more than x2) in their number of sequences (43910 vs 20393). You may be interested by the parameter rarefy_after_merging
# \donttest{
if (requireNamespace("ggVennDiagram")) {
ggvenn_pq(data_fungi_mini, fact = "Height") +
ggplot2::scale_fill_distiller(palette = "BuPu", direction = 1)
pl <- ggvenn_pq(data_fungi_mini, fact = "Height", split_by = "Time")
for (i in seq_along(pl)) {
p <- pl[[i]] +
scale_fill_distiller(palette = "BuPu", direction = 1) +
theme(plot.title = element_text(hjust = 0.5, size = 22))
print(p)
}
data_fungi2 <- subset_samples(
data_fungi_mini,
data_fungi_mini@sam_data$Tree_name == "A10-005" |
data_fungi_mini@sam_data$Height %in% c("Low", "High")
)
ggvenn_pq(data_fungi2, fact = "Height")
ggvenn_pq(data_fungi2, fact = "Height", type = "nb_seq")
ggvenn_pq(data_fungi_mini, fact = "Height", add_nb_seq = TRUE, set_size = 4)
ggvenn_pq(data_fungi_mini, fact = "Height", rarefy_before_merging = TRUE)
ggvenn_pq(data_fungi_mini, fact = "Height", rarefy_after_merging = TRUE) +
scale_x_continuous(expand = expansion(mult = 0.5))
# For more flexibility, you can save the dataset for more precise construction
# with ggplot2 and ggVennDiagramm
# (https://gaospecial.github.io/ggVennDiagram/articles/fully-customed.html)
res_venn <- ggvenn_pq(data_fungi_mini,
fact = "Height",
return_data_for_venn = TRUE
)
ggplot() +
# 1. region count layer
geom_polygon(aes(X, Y, group = id, fill = name),
data = ggVennDiagram::venn_regionedge(res_venn)
) +
scale_fill_manual(values = funky_color(7)) +
# 2. set edge layer
geom_path(aes(X, Y, color = id, group = id),
data = ggVennDiagram::venn_setedge(res_venn),
show.legend = FALSE, linewidth = 2
) +
scale_color_manual(values = c("red", "red", "blue")) +
# 3. set label layer
geom_text(aes(X, Y, label = name),
data = ggVennDiagram::venn_setlabel(res_venn)
) +
# 4. region label layer
geom_label(
aes(X, Y, label = paste0(
count, " (",
scales::percent(count / sum(count), accuracy = 2), ")"
)),
data = ggVennDiagram::venn_regionlabel(res_venn)
) +
theme_void()
}
#> 47 were discarded due to NA in variable fact
#> Taxa are now in columns.
#> Cleaning suppress 11 taxa and 0 samples.
#> Cleaning suppress 11 taxa and 0 samples.
#> Cleaning suppress 11 taxa and 0 samples.
#> 47 were discarded due to NA in variable fact
#> Taxa are now in columns.
#> Cleaning suppress 11 taxa and 0 samples.
#> Cleaning suppress 11 taxa and 0 samples.
#> Cleaning suppress 11 taxa and 0 samples.
#> Cleaning suppress 10 taxa and 0 samples.
#> Cleaning suppress 6 taxa and 0 samples.
#> Cleaning suppress 9 taxa and 0 samples.
#> Cleaning suppress 15 taxa and 0 samples.
#> Cleaning suppress 11 taxa and 0 samples.
#> Cleaning suppress 13 taxa and 0 samples.
#> Two modalities differ greatly (more than x2) in their number of sequences (29085 vs 4489). You may be interested by the parameter rarefy_after_merging
#> Cleaning suppress 9 taxa and 0 samples.
#> Cleaning suppress 7 taxa and 0 samples.
#> Cleaning suppress 12 taxa and 0 samples.
#> Two modalities differ greatly (more than x2) in their number of sequences (13275 vs 5567). You may be interested by the parameter rarefy_after_merging
#> Cleaning suppress 6 taxa and 0 samples.
#> Cleaning suppress 5 taxa and 0 samples.
#> Cleaning suppress 6 taxa and 0 samples.
#> Two modalities differ greatly (more than x2) in their number of sequences (43910 vs 20393). You may be interested by the parameter rarefy_after_merging
 #> Taxa are now in columns.
#> Cleaning suppress 11 taxa and 0 samples.
#> Cleaning suppress 11 taxa and 0 samples.
#> Cleaning suppress 38 taxa and 0 samples.
#> Two modalities differ greatly (more than x2) in their number of sequences (87919 vs 1134). You may be interested by the parameter rarefy_after_merging
#> Taxa are now in columns.
#> Cleaning suppress 11 taxa and 0 samples.
#> Cleaning suppress 11 taxa and 0 samples.
#> Cleaning suppress 38 taxa and 0 samples.
#> Two modalities differ greatly (more than x2) in their number of sequences (87919 vs 1134). You may be interested by the parameter rarefy_after_merging
#> 47 were discarded due to NA in variable fact
#> Taxa are now in columns.
#> Cleaning suppress 11 taxa and 0 samples.
#> Cleaning suppress 11 taxa and 0 samples.
#> Cleaning suppress 11 taxa and 0 samples.
#> 47 were discarded due to NA in variable fact
#> Taxa are now in columns.
#> You set `rngseed` to FALSE. Make sure you've set & recorded
#> the random seed of your session for reproducibility.
#> See `?set.seed`
#> ...
#> Cleaning suppress 15 taxa and 0 samples.
#> Cleaning suppress 12 taxa and 0 samples.
#> Cleaning suppress 15 taxa and 0 samples.
#> 47 were discarded due to NA in variable fact
#> Taxa are now in columns.
#> You set `rngseed` to FALSE. Make sure you've set & recorded
#> the random seed of your session for reproducibility.
#> See `?set.seed`
#> ...
#> Cleaning suppress 9 taxa and 0 samples.
#> Cleaning suppress 8 taxa and 0 samples.
#> Cleaning suppress 9 taxa and 0 samples.
#> 47 were discarded due to NA in variable fact
#> Taxa are now in columns.
#> Cleaning suppress 11 taxa and 0 samples.
#> Cleaning suppress 11 taxa and 0 samples.
#> Cleaning suppress 11 taxa and 0 samples.
#> Taxa are now in columns.
#> Cleaning suppress 11 taxa and 0 samples.
#> Cleaning suppress 11 taxa and 0 samples.
#> Cleaning suppress 38 taxa and 0 samples.
#> Two modalities differ greatly (more than x2) in their number of sequences (87919 vs 1134). You may be interested by the parameter rarefy_after_merging
#> 47 were discarded due to NA in variable fact
#> Taxa are now in columns.
#> Cleaning suppress 11 taxa and 0 samples.
#> Cleaning suppress 11 taxa and 0 samples.
#> Cleaning suppress 11 taxa and 0 samples.
#> 47 were discarded due to NA in variable fact
#> Taxa are now in columns.
#> You set `rngseed` to FALSE. Make sure you've set & recorded
#> the random seed of your session for reproducibility.
#> See `?set.seed`
#> ...
#> Cleaning suppress 15 taxa and 0 samples.
#> Cleaning suppress 12 taxa and 0 samples.
#> Cleaning suppress 15 taxa and 0 samples.
#> 47 were discarded due to NA in variable fact
#> Taxa are now in columns.
#> You set `rngseed` to FALSE. Make sure you've set & recorded
#> the random seed of your session for reproducibility.
#> See `?set.seed`
#> ...
#> Cleaning suppress 9 taxa and 0 samples.
#> Cleaning suppress 8 taxa and 0 samples.
#> Cleaning suppress 9 taxa and 0 samples.
#> 47 were discarded due to NA in variable fact
#> Taxa are now in columns.
#> Cleaning suppress 11 taxa and 0 samples.
#> Cleaning suppress 11 taxa and 0 samples.
#> Cleaning suppress 11 taxa and 0 samples.
 # }
# }