Compute the number of sequence to obtain a given proportion of ASV in accumulation curves
Source:R/plot_functions.R
accu_samp_threshold.Rd
Note that as most bioinformatic pipeline discard singleton, accumulation curves from metabarcoding cannot be interpreted in the same way as with conventional biodiversity sampling techniques.
Value
a value for each sample of the number of sequences needed
to obtain threshold proportion of the ASV
Examples
# \donttest{
data("GlobalPatterns", package = "phyloseq")
GP <- subset_taxa(GlobalPatterns, GlobalPatterns@tax_table[, 1] == "Archaea")
#> Found more than one class "phylo" in cache; using the first, from namespace 'phyloseq'
#> Also defined by ‘RNeXML’
#> Found more than one class "phylo" in cache; using the first, from namespace 'phyloseq'
#> Also defined by ‘RNeXML’
#> Found more than one class "phylo" in cache; using the first, from namespace 'phyloseq'
#> Also defined by ‘RNeXML’
#> Found more than one class "phylo" in cache; using the first, from namespace 'phyloseq'
#> Also defined by ‘RNeXML’
GP <- rarefy_pq(subset_samples_pq(GP, sample_sums(GP) > 3000), replace = TRUE)
#> Found more than one class "phylo" in cache; using the first, from namespace 'phyloseq'
#> Also defined by ‘RNeXML’
#> Found more than one class "phylo" in cache; using the first, from namespace 'phyloseq'
#> Also defined by ‘RNeXML’
#> Found more than one class "phylo" in cache; using the first, from namespace 'phyloseq'
#> Also defined by ‘RNeXML’
#> Found more than one class "phylo" in cache; using the first, from namespace 'phyloseq'
#> Also defined by ‘RNeXML’
#> Found more than one class "phylo" in cache; using the first, from namespace 'phyloseq'
#> Also defined by ‘RNeXML’
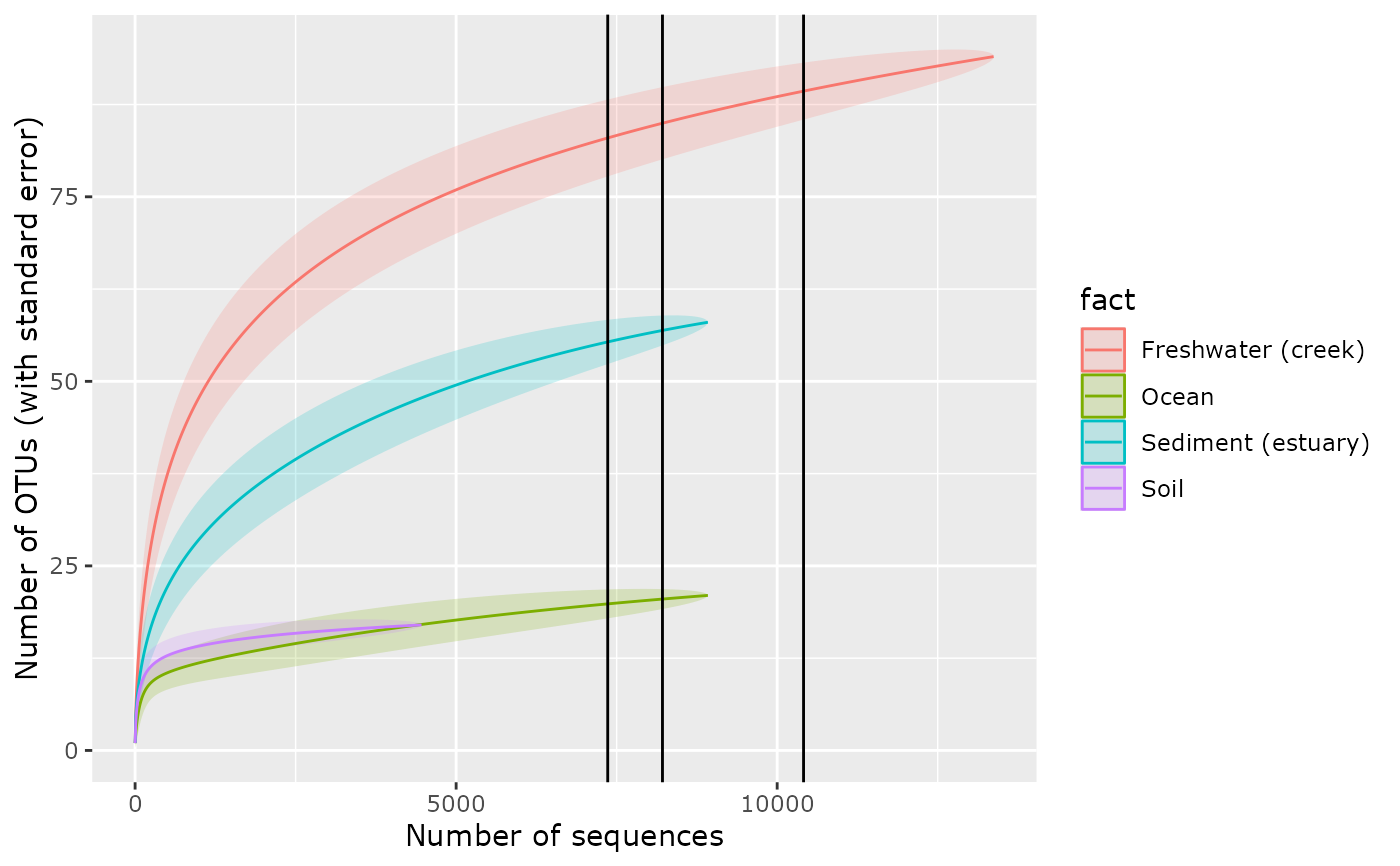
p <- accu_plot(GP, "SampleType", add_nb_seq = TRUE, by.fact = TRUE, step = 10)
val_threshold <- accu_samp_threshold(p)
summary(val_threshold)
#> Min. 1st Qu. Median Mean 3rd Qu. Max.
#> 3551 6094 7261 7084 8251 10261
##' Plot the number of sequences needed to accumulate 0.95% of ASV in 50%, 75%
##' and 100% of samples
p + geom_vline(xintercept = quantile(val_threshold, probs = c(0.50, 0.75, 1)))
#> Warning: Removed 1 row containing missing values or values outside the scale range
#> (`geom_ribbon()`).
#> Warning: Removed 1 row containing missing values or values outside the scale range
#> (`geom_line()`).
 # }
# }