This function implement the method proposed by McKnight et al. 2018 (doi:10.5061/dryad.tn8qs35 )
Arguments
- physeq
(required) a
phyloseq-classobject obtained using thephyloseqpackage.- base_log
(integer, default 2) the base for log-transformation. If set to NULL or NA, no log-transformation is compute after normalization.
- constante
a constante to multiply the otu_table values
- digits
(default = 4) integer indicating the number of decimal places to be used (see
?roundfor more information)
Value
A new phyloseq-class object with otu_table count
normalize and log transformed (if base_log is an integer)
Examples
taxa_sums(data_fungi_mini)
#> ASV7 ASV8 ASV12 ASV18 ASV25 ASV26 ASV27 ASV29 ASV32 ASV34 ASV35
#> 47410 46857 38237 27368 21522 20660 20584 19661 16933 15804 15298
#> ASV41 ASV42 ASV46 ASV47 ASV48 ASV49 ASV50 ASV53 ASV54 ASV58 ASV59
#> 12922 12270 11053 10878 10784 10215 10178 10038 9895 9172 9045
#> ASV61 ASV62 ASV63 ASV64 ASV67 ASV68 ASV71 ASV72 ASV75 ASV77 ASV82
#> 8935 8922 8872 8849 8521 8417 8171 8167 7842 7818 7356
#> ASV83 ASV85 ASV91 ASV93 ASV94 ASV99 ASV100 ASV101 ASV104 ASV105 ASV107
#> 7328 7145 6319 5886 5842 5699 5675 5649 5566 5467 5158
#> ASV108
#> 5137
data_f_norm <- normalize_prop_pq(data_fungi_mini)
taxa_sums(data_f_norm)
#> ASV7 ASV8 ASV12 ASV18 ASV25 ASV26 ASV27 ASV29
#> 414.6046 644.1998 249.0031 259.4578 114.5518 118.3969 39.8368 103.1480
#> ASV32 ASV34 ASV35 ASV41 ASV42 ASV46 ASV47 ASV48
#> 82.3404 372.7509 80.0378 78.9897 83.1868 93.3887 32.1618 25.6481
#> ASV49 ASV50 ASV53 ASV54 ASV58 ASV59 ASV61 ASV62
#> 45.3490 23.2659 40.4996 13.2874 63.4629 51.1092 39.3335 61.9517
#> ASV63 ASV64 ASV67 ASV68 ASV71 ASV72 ASV75 ASV77
#> 20.9074 30.8507 48.5672 12.9911 380.9520 53.6068 30.4545 15.5597
#> ASV82 ASV83 ASV85 ASV91 ASV93 ASV94 ASV99 ASV100
#> 22.2811 177.5237 68.8903 71.8991 15.5826 234.0406 33.1109 19.7700
#> ASV101 ASV104 ASV105 ASV107 ASV108
#> 43.5813 49.3524 27.2813 100.0606 11.9978
sample_sums(data_f_norm)
#> A10-005-B_S188_MERGED.fastq.gz A10-005-H_S189_MERGED.fastq.gz
#> 56.4639 20.5319
#> A10-005-M_S190_MERGED.fastq.gz A12-007_S191_MERGED.fastq.gz
#> 62.8780 68.0266
#> A12-007-B_S2_MERGED.fastq.gz A15-004_S3_MERGED.fastq.gz
#> 24.5575 33.7729
#> A8-005_S4_MERGED.fastq.gz AB29-ABMX-H_S6_MERGED.fastq.gz
#> 48.4494 43.6426
#> AC27-013_S7_MERGED.fastq.gz AC29033_S8_MERGED.fastq.gz
#> 25.6307 28.3146
#> AD26-005-B_S9_MERGED.fastq.gz AD26-005-H_S10_MERGED.fastq.gz
#> 31.3587 20.0134
#> AD26-005-M_S11_MERGED.fastq.gz AD30-ABMX-M_S12_MERGED.fastq.gz
#> 38.6185 22.5620
#> AD32-007-M_S13_MERGED.fastq.gz ADABM30X-B_S14_MERGED.fastq.gz
#> 40.2840 43.4480
#> ADABM30X-H_S15_MERGED.fastq.gz ADABM30X-M_S16_MERGED.fastq.gz
#> 58.3284 29.9095
#> AE30-ABM507_S17_MERGED.fastq.gz B17-014_S18_MERGED.fastq.gz
#> 47.8866 41.1063
#> B18-006-B_S19_MERGED.fastq.gz BA16-036bis_S20_MERGED.fastq.gz
#> 23.9184 47.2516
#> BA17-050-B_S21_MERGED.fastq.gz BB19-006-H_S22_MERGED.fastq.gz
#> 51.6267 30.7262
#> BB6-019-M_S25_MERGED.fastq.gz BD14-021_S26_MERGED.fastq.gz
#> 42.9718 53.8606
#> BG7-010-H_S31_MERGED.fastq.gz BH9-021_S33_MERGED.fastq.gz
#> 13.2879 13.2879
#> BJ17-007-M_S34_MERGED.fastq.gz BJ8-ABM-003_S35_MERGED.fastq.gz
#> 42.8796 38.5599
#> BL7-006-H_S37_MERGED.fastq.gz BN11-041_S39_MERGED.fastq.gz
#> 13.2879 37.0652
#> BO8-002_S41_MERGED.fastq.gz BO8-005_S42_MERGED.fastq.gz
#> 44.0824 13.2879
#> BP11-001-B_S43_MERGED.fastq.gz BP11-001-H_S44_MERGED.fastq.gz
#> 25.4672 59.6820
#> BP11-001-M_S45_MERGED.fastq.gz BP12-025-B_S46_MERGED.fastq.gz
#> 28.2860 13.2879
#> BP14-006_S47_MERGED.fastq.gz BQ3-019_S48_MERGED.fastq.gz
#> 78.1088 13.2879
#> BQ4-018-B_S49_MERGED.fastq.gz BQ4-018-H_S50_MERGED.fastq.gz
#> 16.3096 15.4555
#> BQ4-018-M_S51_MERGED.fastq.gz BQ9ABM-002_S52_MERGED.fastq.gz
#> 32.8834 23.0957
#> BR8-005_S53_MERGED.fastq.gz BS14-006_S54_MERGED.fastq.gz
#> 13.2879 41.9130
#> BT-006-M_S55_MERGED.fastq.gz BT7-006_S56_MERGED.fastq.gz
#> 21.3573 13.2879
#> BV11-002-B_S57_MERGED.fastq.gz BV11-002-H_S58_MERGED.fastq.gz
#> 44.5552 53.3868
#> BV11-002-M_S59_MERGED.fastq.gz BW8-003_S60_MERGED.fastq.gz
#> 32.5439 58.5865
#> C1-001_S61_MERGED.fastq.gz C21-NV1-B_S62_MERGED.fastq.gz
#> 50.0806 29.0721
#> C9-005_S65_MERGED.fastq.gz CA9-X_S68_MERGED.fastq.gz
#> 56.6746 32.3182
#> CB8-019-B_S69_MERGED.fastq.gz CB8-019-H_S70_MERGED.fastq.gz
#> 13.2879 13.2879
#> CB8-019-M_S71_MERGED.fastq.gz CB9-013_S72_MERGED.fastq.gz
#> 13.2879 76.4501
#> CC3-044_S73_MERGED.fastq.gz D17-011_S77_MERGED.fastq.gz
#> 54.4131 48.2315
#> D18-003-B_S78_MERGED.fastq.gz D18-003-M_S80_MERGED.fastq.gz
#> 44.8951 46.7198
#> D22-NVABM1_S81_MERGED.fastq.gz D61-010-B_S82_MERGED.fastq.gz
#> 36.5631 17.4072
#> D9-027-H_S84_MERGED.fastq.gz D9-027-M_S85_MERGED.fastq.gz
#> 13.2879 13.2879
#> DBM-ABM-001_S86_MERGED.fastq.gz DJ2-008-H_S88_MERGED.fastq.gz
#> 52.9096 30.9607
#> DP4-ABM001_S90_MERGED.fastq.gz DS1-ABM002-B_S91_MERGED.fastq.gz
#> 16.2900 13.2879
#> DS1-ABM002-H_S92_MERGED.fastq.gz DS1-ABM002-M_S93_MERGED.fastq.gz
#> 33.6204 52.3169
#> DU3-045-B_S94_MERGED.fastq.gz DW4-007_S95_MERGED.fastq.gz
#> 45.2980 17.0681
#> DY5-004-B_S96_MERGED.fastq.gz DY5-004-H_S97_MERGED.fastq.gz
#> 24.5463 13.2879
#> DZ6-ABM-001_S99_MERGED.fastq.gz EA5-ABM-001_S103_MERGED.fastq.gz
#> 20.5322 19.2617
#> EC2-013-B_S104_MERGED.fastq.gz F6-ABM-001_S105_MERGED.fastq.gz
#> 25.4070 29.1387
#> F7-015-M_S106_MERGED.fastq.gz FOMES19-H_S108_MERGED.fastq.gz
#> 13.2879 28.0788
#> FOMES19-M_S109_MERGED.fastq.gz H10-018-M_S110_MERGED.fastq.gz
#> 17.1530 13.2879
#> H24-NVABM1-H_S111_MERGED.fastq.gz J18-004-B_S114_MERGED.fastq.gz
#> 30.2073 13.2879
#> J18-004-M_S116_MERGED.fastq.gz K18-002-H_S117_MERGED.fastq.gz
#> 13.2879 51.1530
#> K26-NVABM1_S118_MERGED.fastq.gz L19X-B_S119_MERGED.fastq.gz
#> 39.3808 13.2879
#> L19X-H_S120_MERGED.fastq.gz L19X-M_S121_MERGED.fastq.gz
#> 50.2658 53.3305
#> L23-002-B_S122_MERGED.fastq.gz L23-002-H_S123_MERGED.fastq.gz
#> 51.0257 56.3680
#> L23-002-M_S124_MERGED.fastq.gz N19X-H_S127_MERGED.fastq.gz
#> 29.6523 45.7446
#> N19X-M_S128_MERGED.fastq.gz N23-002-B_S130_MERGED.fastq.gz
#> 46.4100 24.4062
#> N23-002-H_S131_MERGED.fastq.gz N25-ABMX_S133_MERGED.fastq.gz
#> 28.5111 17.4852
#> NVABM-0058_S134_MERGED.fastq.gz NVABM-0163-H_S135_MERGED.fastq.gz
#> 22.5722 19.1251
#> NVABM-0397_S138_MERGED.fastq.gz NVABM0216_S136_MERGED.fastq.gz
#> 23.5225 34.0719
#> NVABM0244-M_S137_MERGED.fastq.gz O20-X-H_S140_MERGED.fastq.gz
#> 13.2879 56.0570
#> O20-X-M_S141_MERGED.fastq.gz O24-003-B_S145_MERGED.fastq.gz
#> 45.0654 13.2879
#> O26-004-B_S148_MERGED.fastq.gz O27-012_S151_MERGED.fastq.gz
#> 23.0404 13.2879
#> O9-005-B_S152_MERGED.fastq.gz P19-023-M_S153_MERGED.fastq.gz
#> 39.7112 31.9806
#> P27-015-M_S154_MERGED.fastq.gz P27-ABM001_S155_MERGED.fastq.gz
#> 31.6989 24.5760
#> Q27-ABM003-B_S156_MERGED.fastq.gz R25-ABMX_S157_MERGED.fastq.gz
#> 13.2879 64.9009
#> T28-011_S161_MERGED.fastq.gz T28-ABM602-B_S162_MERGED.fastq.gz
#> 25.9475 24.3081
#> U27-ABM002_S163_MERGED.fastq.gz W25-ABMX_S164_MERGED.fastq.gz
#> 54.8569 36.1715
#> W26-001-B_S165_MERGED.fastq.gz W30-006_S168_MERGED.fastq.gz
#> 13.2879 65.2531
#> W9-025-M_S169_MERGED.fastq.gz X24-009-B_S170_MERGED.fastq.gz
#> 24.5760 45.1385
#> X24-009-H_S171_MERGED.fastq.gz X24-009-M_S172_MERGED.fastq.gz
#> 56.8129 49.7455
#> X24-010_S173_MERGED.fastq.gz X29-004-B_S174_MERGED.fastq.gz
#> 14.2361 13.2879
#> X29-004-H_S175_MERGED.fastq.gz X29-004-M_S176_MERGED.fastq.gz
#> 63.0724 34.5701
#> Y21-ABM484-H_S177_MERGED.fastq.gz Y28-002-B_S178_MERGED.fastq.gz
#> 43.1264 23.2370
#> Y31-ABM484-B_S184_MERGED.fastq.gz Z29-001-H_S185_MERGED.fastq.gz
#> 56.2590 24.4062
#> Z30-ABM560-M_S187_MERGED.fastq.gz
#> 35.9945
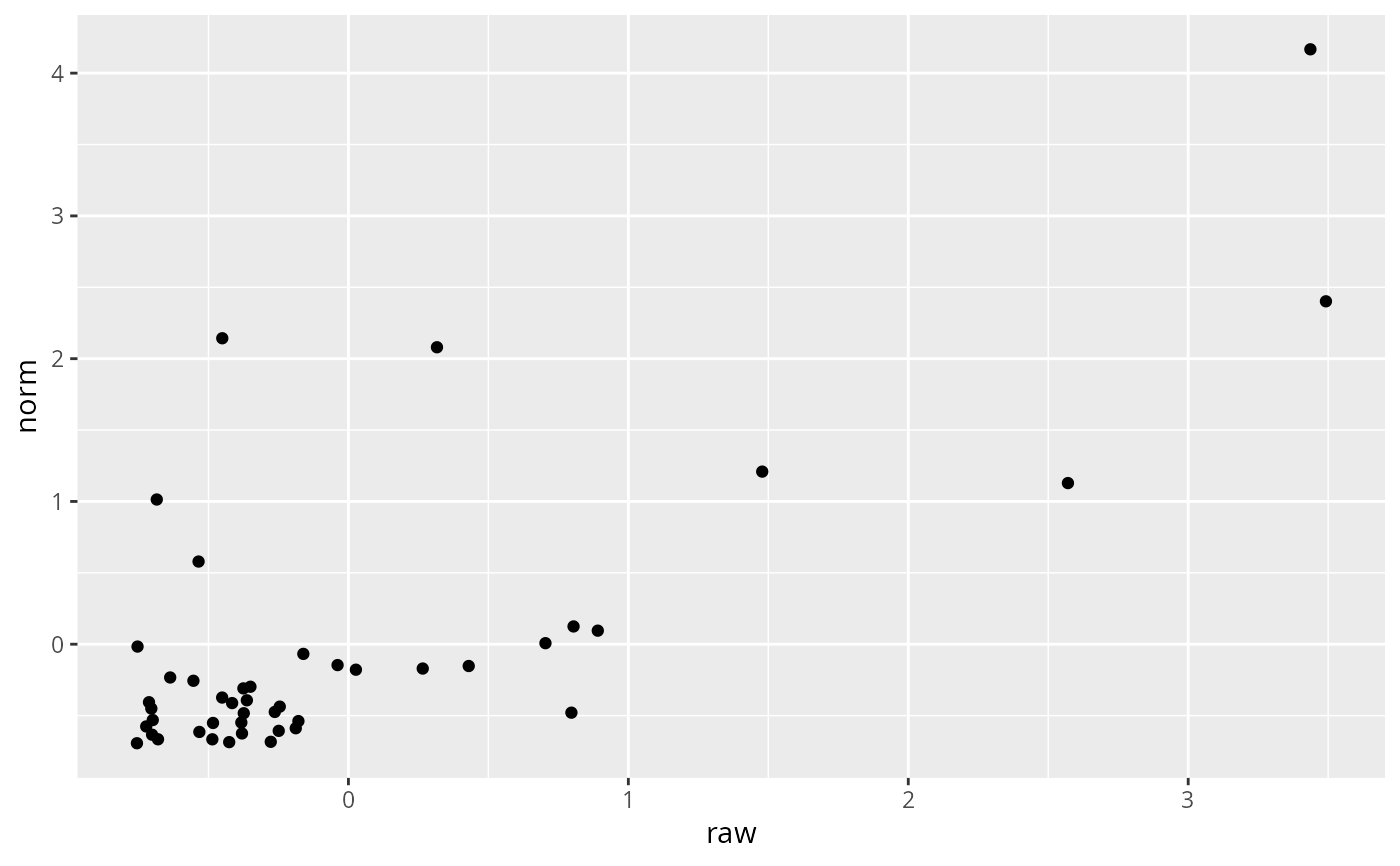
ggplot(data.frame(
"norm" = scale(taxa_sums(data_f_norm)),
"raw" = scale(taxa_sums(data_fungi_mini)),
"name_otu" = taxa_names(data_f_norm)
)) +
geom_point(aes(x = raw, y = norm))
 data_f_norm <- normalize_prop_pq(taxa_as_columns(data_fungi_mini))
#> Taxa are now in columns.
data_f_norm2 <- normalize_prop_pq(data_fungi_mini, base_log = NULL)
taxa_sums(data_f_norm2)
#> ASV7 ASV8 ASV12 ASV18 ASV25 ASV26 ASV27
#> 122882.103 211168.629 100283.124 47121.139 45244.227 38079.149 18656.710
#> ASV29 ASV32 ASV34 ASV35 ASV41 ASV42 ASV46
#> 35184.482 40355.938 81888.345 28010.586 32195.022 22341.650 49044.340
#> ASV47 ASV48 ASV49 ASV50 ASV53 ASV54 ASV58
#> 11909.577 10302.821 23479.328 6909.826 9755.854 9996.969 15433.706
#> ASV59 ASV61 ASV62 ASV63 ASV64 ASV67 ASV68
#> 26317.510 8675.171 19572.139 3937.221 11148.767 12727.125 2197.569
#> ASV71 ASV72 ASV75 ASV77 ASV82 ASV83 ASV85
#> 86220.684 15653.077 10800.213 2061.804 6722.797 26535.302 18370.491
#> ASV91 ASV93 ASV94 ASV99 ASV100 ASV101 ASV104
#> 31281.214 3511.832 15667.432 6316.609 9500.050 27400.953 16502.328
#> ASV105 ASV107 ASV108
#> 9457.149 35090.372 4088.666
sample_sums(data_f_norm2)
#> A10-005-B_S188_MERGED.fastq.gz A10-005-H_S189_MERGED.fastq.gz
#> 10000 10000
#> A10-005-M_S190_MERGED.fastq.gz A12-007_S191_MERGED.fastq.gz
#> 10000 10000
#> A12-007-B_S2_MERGED.fastq.gz A15-004_S3_MERGED.fastq.gz
#> 10000 10000
#> A8-005_S4_MERGED.fastq.gz AB29-ABMX-H_S6_MERGED.fastq.gz
#> 10000 10000
#> AC27-013_S7_MERGED.fastq.gz AC29033_S8_MERGED.fastq.gz
#> 10000 10000
#> AD26-005-B_S9_MERGED.fastq.gz AD26-005-H_S10_MERGED.fastq.gz
#> 10000 10000
#> AD26-005-M_S11_MERGED.fastq.gz AD30-ABMX-M_S12_MERGED.fastq.gz
#> 10000 10000
#> AD32-007-M_S13_MERGED.fastq.gz ADABM30X-B_S14_MERGED.fastq.gz
#> 10000 10000
#> ADABM30X-H_S15_MERGED.fastq.gz ADABM30X-M_S16_MERGED.fastq.gz
#> 10000 10000
#> AE30-ABM507_S17_MERGED.fastq.gz B17-014_S18_MERGED.fastq.gz
#> 10000 10000
#> B18-006-B_S19_MERGED.fastq.gz BA16-036bis_S20_MERGED.fastq.gz
#> 10000 10000
#> BA17-050-B_S21_MERGED.fastq.gz BB19-006-H_S22_MERGED.fastq.gz
#> 10000 10000
#> BB6-019-M_S25_MERGED.fastq.gz BD14-021_S26_MERGED.fastq.gz
#> 10000 10000
#> BG7-010-H_S31_MERGED.fastq.gz BH9-021_S33_MERGED.fastq.gz
#> 10000 10000
#> BJ17-007-M_S34_MERGED.fastq.gz BJ8-ABM-003_S35_MERGED.fastq.gz
#> 10000 10000
#> BL7-006-H_S37_MERGED.fastq.gz BN11-041_S39_MERGED.fastq.gz
#> 10000 10000
#> BO8-002_S41_MERGED.fastq.gz BO8-005_S42_MERGED.fastq.gz
#> 10000 10000
#> BP11-001-B_S43_MERGED.fastq.gz BP11-001-H_S44_MERGED.fastq.gz
#> 10000 10000
#> BP11-001-M_S45_MERGED.fastq.gz BP12-025-B_S46_MERGED.fastq.gz
#> 10000 10000
#> BP14-006_S47_MERGED.fastq.gz BQ3-019_S48_MERGED.fastq.gz
#> 10000 10000
#> BQ4-018-B_S49_MERGED.fastq.gz BQ4-018-H_S50_MERGED.fastq.gz
#> 10000 10000
#> BQ4-018-M_S51_MERGED.fastq.gz BQ9ABM-002_S52_MERGED.fastq.gz
#> 10000 10000
#> BR8-005_S53_MERGED.fastq.gz BS14-006_S54_MERGED.fastq.gz
#> 10000 10000
#> BT-006-M_S55_MERGED.fastq.gz BT7-006_S56_MERGED.fastq.gz
#> 10000 10000
#> BV11-002-B_S57_MERGED.fastq.gz BV11-002-H_S58_MERGED.fastq.gz
#> 10000 10000
#> BV11-002-M_S59_MERGED.fastq.gz BW8-003_S60_MERGED.fastq.gz
#> 10000 10000
#> C1-001_S61_MERGED.fastq.gz C21-NV1-B_S62_MERGED.fastq.gz
#> 10000 10000
#> C9-005_S65_MERGED.fastq.gz CA9-X_S68_MERGED.fastq.gz
#> 10000 10000
#> CB8-019-B_S69_MERGED.fastq.gz CB8-019-H_S70_MERGED.fastq.gz
#> 10000 10000
#> CB8-019-M_S71_MERGED.fastq.gz CB9-013_S72_MERGED.fastq.gz
#> 10000 10000
#> CC3-044_S73_MERGED.fastq.gz D17-011_S77_MERGED.fastq.gz
#> 10000 10000
#> D18-003-B_S78_MERGED.fastq.gz D18-003-M_S80_MERGED.fastq.gz
#> 10000 10000
#> D22-NVABM1_S81_MERGED.fastq.gz D61-010-B_S82_MERGED.fastq.gz
#> 10000 10000
#> D9-027-H_S84_MERGED.fastq.gz D9-027-M_S85_MERGED.fastq.gz
#> 10000 10000
#> DBM-ABM-001_S86_MERGED.fastq.gz DJ2-008-H_S88_MERGED.fastq.gz
#> 10000 10000
#> DP4-ABM001_S90_MERGED.fastq.gz DS1-ABM002-B_S91_MERGED.fastq.gz
#> 10000 10000
#> DS1-ABM002-H_S92_MERGED.fastq.gz DS1-ABM002-M_S93_MERGED.fastq.gz
#> 10000 10000
#> DU3-045-B_S94_MERGED.fastq.gz DW4-007_S95_MERGED.fastq.gz
#> 10000 10000
#> DY5-004-B_S96_MERGED.fastq.gz DY5-004-H_S97_MERGED.fastq.gz
#> 10000 10000
#> DZ6-ABM-001_S99_MERGED.fastq.gz EA5-ABM-001_S103_MERGED.fastq.gz
#> 10000 10000
#> EC2-013-B_S104_MERGED.fastq.gz F6-ABM-001_S105_MERGED.fastq.gz
#> 10000 10000
#> F7-015-M_S106_MERGED.fastq.gz FOMES19-H_S108_MERGED.fastq.gz
#> 10000 10000
#> FOMES19-M_S109_MERGED.fastq.gz H10-018-M_S110_MERGED.fastq.gz
#> 10000 10000
#> H24-NVABM1-H_S111_MERGED.fastq.gz J18-004-B_S114_MERGED.fastq.gz
#> 10000 10000
#> J18-004-M_S116_MERGED.fastq.gz K18-002-H_S117_MERGED.fastq.gz
#> 10000 10000
#> K26-NVABM1_S118_MERGED.fastq.gz L19X-B_S119_MERGED.fastq.gz
#> 10000 10000
#> L19X-H_S120_MERGED.fastq.gz L19X-M_S121_MERGED.fastq.gz
#> 10000 10000
#> L23-002-B_S122_MERGED.fastq.gz L23-002-H_S123_MERGED.fastq.gz
#> 10000 10000
#> L23-002-M_S124_MERGED.fastq.gz N19X-H_S127_MERGED.fastq.gz
#> 10000 10000
#> N19X-M_S128_MERGED.fastq.gz N23-002-B_S130_MERGED.fastq.gz
#> 10000 10000
#> N23-002-H_S131_MERGED.fastq.gz N25-ABMX_S133_MERGED.fastq.gz
#> 10000 10000
#> NVABM-0058_S134_MERGED.fastq.gz NVABM-0163-H_S135_MERGED.fastq.gz
#> 10000 10000
#> NVABM-0397_S138_MERGED.fastq.gz NVABM0216_S136_MERGED.fastq.gz
#> 10000 10000
#> NVABM0244-M_S137_MERGED.fastq.gz O20-X-H_S140_MERGED.fastq.gz
#> 10000 10000
#> O20-X-M_S141_MERGED.fastq.gz O24-003-B_S145_MERGED.fastq.gz
#> 10000 10000
#> O26-004-B_S148_MERGED.fastq.gz O27-012_S151_MERGED.fastq.gz
#> 10000 10000
#> O9-005-B_S152_MERGED.fastq.gz P19-023-M_S153_MERGED.fastq.gz
#> 10000 10000
#> P27-015-M_S154_MERGED.fastq.gz P27-ABM001_S155_MERGED.fastq.gz
#> 10000 10000
#> Q27-ABM003-B_S156_MERGED.fastq.gz R25-ABMX_S157_MERGED.fastq.gz
#> 10000 10000
#> T28-011_S161_MERGED.fastq.gz T28-ABM602-B_S162_MERGED.fastq.gz
#> 10000 10000
#> U27-ABM002_S163_MERGED.fastq.gz W25-ABMX_S164_MERGED.fastq.gz
#> 10000 10000
#> W26-001-B_S165_MERGED.fastq.gz W30-006_S168_MERGED.fastq.gz
#> 10000 10000
#> W9-025-M_S169_MERGED.fastq.gz X24-009-B_S170_MERGED.fastq.gz
#> 10000 10000
#> X24-009-H_S171_MERGED.fastq.gz X24-009-M_S172_MERGED.fastq.gz
#> 10000 10000
#> X24-010_S173_MERGED.fastq.gz X29-004-B_S174_MERGED.fastq.gz
#> 10000 10000
#> X29-004-H_S175_MERGED.fastq.gz X29-004-M_S176_MERGED.fastq.gz
#> 10000 10000
#> Y21-ABM484-H_S177_MERGED.fastq.gz Y28-002-B_S178_MERGED.fastq.gz
#> 10000 10000
#> Y31-ABM484-B_S184_MERGED.fastq.gz Z29-001-H_S185_MERGED.fastq.gz
#> 10000 10000
#> Z30-ABM560-M_S187_MERGED.fastq.gz
#> 10000
data_f_norm <- normalize_prop_pq(taxa_as_columns(data_fungi_mini))
#> Taxa are now in columns.
data_f_norm2 <- normalize_prop_pq(data_fungi_mini, base_log = NULL)
taxa_sums(data_f_norm2)
#> ASV7 ASV8 ASV12 ASV18 ASV25 ASV26 ASV27
#> 122882.103 211168.629 100283.124 47121.139 45244.227 38079.149 18656.710
#> ASV29 ASV32 ASV34 ASV35 ASV41 ASV42 ASV46
#> 35184.482 40355.938 81888.345 28010.586 32195.022 22341.650 49044.340
#> ASV47 ASV48 ASV49 ASV50 ASV53 ASV54 ASV58
#> 11909.577 10302.821 23479.328 6909.826 9755.854 9996.969 15433.706
#> ASV59 ASV61 ASV62 ASV63 ASV64 ASV67 ASV68
#> 26317.510 8675.171 19572.139 3937.221 11148.767 12727.125 2197.569
#> ASV71 ASV72 ASV75 ASV77 ASV82 ASV83 ASV85
#> 86220.684 15653.077 10800.213 2061.804 6722.797 26535.302 18370.491
#> ASV91 ASV93 ASV94 ASV99 ASV100 ASV101 ASV104
#> 31281.214 3511.832 15667.432 6316.609 9500.050 27400.953 16502.328
#> ASV105 ASV107 ASV108
#> 9457.149 35090.372 4088.666
sample_sums(data_f_norm2)
#> A10-005-B_S188_MERGED.fastq.gz A10-005-H_S189_MERGED.fastq.gz
#> 10000 10000
#> A10-005-M_S190_MERGED.fastq.gz A12-007_S191_MERGED.fastq.gz
#> 10000 10000
#> A12-007-B_S2_MERGED.fastq.gz A15-004_S3_MERGED.fastq.gz
#> 10000 10000
#> A8-005_S4_MERGED.fastq.gz AB29-ABMX-H_S6_MERGED.fastq.gz
#> 10000 10000
#> AC27-013_S7_MERGED.fastq.gz AC29033_S8_MERGED.fastq.gz
#> 10000 10000
#> AD26-005-B_S9_MERGED.fastq.gz AD26-005-H_S10_MERGED.fastq.gz
#> 10000 10000
#> AD26-005-M_S11_MERGED.fastq.gz AD30-ABMX-M_S12_MERGED.fastq.gz
#> 10000 10000
#> AD32-007-M_S13_MERGED.fastq.gz ADABM30X-B_S14_MERGED.fastq.gz
#> 10000 10000
#> ADABM30X-H_S15_MERGED.fastq.gz ADABM30X-M_S16_MERGED.fastq.gz
#> 10000 10000
#> AE30-ABM507_S17_MERGED.fastq.gz B17-014_S18_MERGED.fastq.gz
#> 10000 10000
#> B18-006-B_S19_MERGED.fastq.gz BA16-036bis_S20_MERGED.fastq.gz
#> 10000 10000
#> BA17-050-B_S21_MERGED.fastq.gz BB19-006-H_S22_MERGED.fastq.gz
#> 10000 10000
#> BB6-019-M_S25_MERGED.fastq.gz BD14-021_S26_MERGED.fastq.gz
#> 10000 10000
#> BG7-010-H_S31_MERGED.fastq.gz BH9-021_S33_MERGED.fastq.gz
#> 10000 10000
#> BJ17-007-M_S34_MERGED.fastq.gz BJ8-ABM-003_S35_MERGED.fastq.gz
#> 10000 10000
#> BL7-006-H_S37_MERGED.fastq.gz BN11-041_S39_MERGED.fastq.gz
#> 10000 10000
#> BO8-002_S41_MERGED.fastq.gz BO8-005_S42_MERGED.fastq.gz
#> 10000 10000
#> BP11-001-B_S43_MERGED.fastq.gz BP11-001-H_S44_MERGED.fastq.gz
#> 10000 10000
#> BP11-001-M_S45_MERGED.fastq.gz BP12-025-B_S46_MERGED.fastq.gz
#> 10000 10000
#> BP14-006_S47_MERGED.fastq.gz BQ3-019_S48_MERGED.fastq.gz
#> 10000 10000
#> BQ4-018-B_S49_MERGED.fastq.gz BQ4-018-H_S50_MERGED.fastq.gz
#> 10000 10000
#> BQ4-018-M_S51_MERGED.fastq.gz BQ9ABM-002_S52_MERGED.fastq.gz
#> 10000 10000
#> BR8-005_S53_MERGED.fastq.gz BS14-006_S54_MERGED.fastq.gz
#> 10000 10000
#> BT-006-M_S55_MERGED.fastq.gz BT7-006_S56_MERGED.fastq.gz
#> 10000 10000
#> BV11-002-B_S57_MERGED.fastq.gz BV11-002-H_S58_MERGED.fastq.gz
#> 10000 10000
#> BV11-002-M_S59_MERGED.fastq.gz BW8-003_S60_MERGED.fastq.gz
#> 10000 10000
#> C1-001_S61_MERGED.fastq.gz C21-NV1-B_S62_MERGED.fastq.gz
#> 10000 10000
#> C9-005_S65_MERGED.fastq.gz CA9-X_S68_MERGED.fastq.gz
#> 10000 10000
#> CB8-019-B_S69_MERGED.fastq.gz CB8-019-H_S70_MERGED.fastq.gz
#> 10000 10000
#> CB8-019-M_S71_MERGED.fastq.gz CB9-013_S72_MERGED.fastq.gz
#> 10000 10000
#> CC3-044_S73_MERGED.fastq.gz D17-011_S77_MERGED.fastq.gz
#> 10000 10000
#> D18-003-B_S78_MERGED.fastq.gz D18-003-M_S80_MERGED.fastq.gz
#> 10000 10000
#> D22-NVABM1_S81_MERGED.fastq.gz D61-010-B_S82_MERGED.fastq.gz
#> 10000 10000
#> D9-027-H_S84_MERGED.fastq.gz D9-027-M_S85_MERGED.fastq.gz
#> 10000 10000
#> DBM-ABM-001_S86_MERGED.fastq.gz DJ2-008-H_S88_MERGED.fastq.gz
#> 10000 10000
#> DP4-ABM001_S90_MERGED.fastq.gz DS1-ABM002-B_S91_MERGED.fastq.gz
#> 10000 10000
#> DS1-ABM002-H_S92_MERGED.fastq.gz DS1-ABM002-M_S93_MERGED.fastq.gz
#> 10000 10000
#> DU3-045-B_S94_MERGED.fastq.gz DW4-007_S95_MERGED.fastq.gz
#> 10000 10000
#> DY5-004-B_S96_MERGED.fastq.gz DY5-004-H_S97_MERGED.fastq.gz
#> 10000 10000
#> DZ6-ABM-001_S99_MERGED.fastq.gz EA5-ABM-001_S103_MERGED.fastq.gz
#> 10000 10000
#> EC2-013-B_S104_MERGED.fastq.gz F6-ABM-001_S105_MERGED.fastq.gz
#> 10000 10000
#> F7-015-M_S106_MERGED.fastq.gz FOMES19-H_S108_MERGED.fastq.gz
#> 10000 10000
#> FOMES19-M_S109_MERGED.fastq.gz H10-018-M_S110_MERGED.fastq.gz
#> 10000 10000
#> H24-NVABM1-H_S111_MERGED.fastq.gz J18-004-B_S114_MERGED.fastq.gz
#> 10000 10000
#> J18-004-M_S116_MERGED.fastq.gz K18-002-H_S117_MERGED.fastq.gz
#> 10000 10000
#> K26-NVABM1_S118_MERGED.fastq.gz L19X-B_S119_MERGED.fastq.gz
#> 10000 10000
#> L19X-H_S120_MERGED.fastq.gz L19X-M_S121_MERGED.fastq.gz
#> 10000 10000
#> L23-002-B_S122_MERGED.fastq.gz L23-002-H_S123_MERGED.fastq.gz
#> 10000 10000
#> L23-002-M_S124_MERGED.fastq.gz N19X-H_S127_MERGED.fastq.gz
#> 10000 10000
#> N19X-M_S128_MERGED.fastq.gz N23-002-B_S130_MERGED.fastq.gz
#> 10000 10000
#> N23-002-H_S131_MERGED.fastq.gz N25-ABMX_S133_MERGED.fastq.gz
#> 10000 10000
#> NVABM-0058_S134_MERGED.fastq.gz NVABM-0163-H_S135_MERGED.fastq.gz
#> 10000 10000
#> NVABM-0397_S138_MERGED.fastq.gz NVABM0216_S136_MERGED.fastq.gz
#> 10000 10000
#> NVABM0244-M_S137_MERGED.fastq.gz O20-X-H_S140_MERGED.fastq.gz
#> 10000 10000
#> O20-X-M_S141_MERGED.fastq.gz O24-003-B_S145_MERGED.fastq.gz
#> 10000 10000
#> O26-004-B_S148_MERGED.fastq.gz O27-012_S151_MERGED.fastq.gz
#> 10000 10000
#> O9-005-B_S152_MERGED.fastq.gz P19-023-M_S153_MERGED.fastq.gz
#> 10000 10000
#> P27-015-M_S154_MERGED.fastq.gz P27-ABM001_S155_MERGED.fastq.gz
#> 10000 10000
#> Q27-ABM003-B_S156_MERGED.fastq.gz R25-ABMX_S157_MERGED.fastq.gz
#> 10000 10000
#> T28-011_S161_MERGED.fastq.gz T28-ABM602-B_S162_MERGED.fastq.gz
#> 10000 10000
#> U27-ABM002_S163_MERGED.fastq.gz W25-ABMX_S164_MERGED.fastq.gz
#> 10000 10000
#> W26-001-B_S165_MERGED.fastq.gz W30-006_S168_MERGED.fastq.gz
#> 10000 10000
#> W9-025-M_S169_MERGED.fastq.gz X24-009-B_S170_MERGED.fastq.gz
#> 10000 10000
#> X24-009-H_S171_MERGED.fastq.gz X24-009-M_S172_MERGED.fastq.gz
#> 10000 10000
#> X24-010_S173_MERGED.fastq.gz X29-004-B_S174_MERGED.fastq.gz
#> 10000 10000
#> X29-004-H_S175_MERGED.fastq.gz X29-004-M_S176_MERGED.fastq.gz
#> 10000 10000
#> Y21-ABM484-H_S177_MERGED.fastq.gz Y28-002-B_S178_MERGED.fastq.gz
#> 10000 10000
#> Y31-ABM484-B_S184_MERGED.fastq.gz Z29-001-H_S185_MERGED.fastq.gz
#> 10000 10000
#> Z30-ABM560-M_S187_MERGED.fastq.gz
#> 10000