A wrapper of plot_ordination with vegan distance matrix
Source:R/plot_functions.R
plot_ordination_pq.RdA wrapper of plot_ordination with vegan distance matrix
Usage
plot_ordination_pq(
  physeq,
  method = "robust.aitchison",
  ordination_method = "NMDS",
  add_envfit = FALSE,
  envfit_fact = NULL,
  envfit_pval = 1,
  envfit_arrow_mult = 1,
  envfit_text_size = 3,
  envfit_col = "black",
  ...
)
Arguments
- physeq
(required) a
phyloseq-classobject obtained using thephyloseqpackage.- method
(string, default "robust.aitchison") The distance method to use from vegan::vegdist(). See ?vegan::vegdist for more details.
- ordination_method
(string, default "NMDS") The ordination method to use in phyloseq::ordinate(). See ?phyloseq::ordinate for more details.
- add_envfit
(logical, default FALSE) If TRUE, overlay environmental vectors (and factor centroids) fitted to the ordination using
vegan::envfit(). Continuous variables are shown as arrows and factor variables as labelled centroids.- envfit_fact
(default NULL) A character vector of variable names from
physeq@sam_datato fit onto the ordination. When NULL (default) andadd_envfit = TRUE, every variable ofphyseq@sam_datais used; passing an explicit subset is recommended, as fitting identifier or high-cardinality character columns produces a cluttered overlay.- envfit_pval
(float, default 1) Only environmental variables with an
vegan::envfit()p-value lower than or equal to this threshold are drawn. The default (1) draws all of them.- envfit_arrow_mult
(float, default 1) A multiplier applied to the environmental arrow lengths, to scale them for readability.
- envfit_text_size
(float, default 3) Text size for the environmental variable labels.
- envfit_col
(default "black") Color of the environmental arrows, centroids and labels.
- ...
Additional arguments passed on to phyloseq::plot_ordination()
Details
Basically a wrapper of phyloseq::plot_ordination() to use aitchison and
robust.aitchison distances from vegan package.
Examples
library(patchwork)
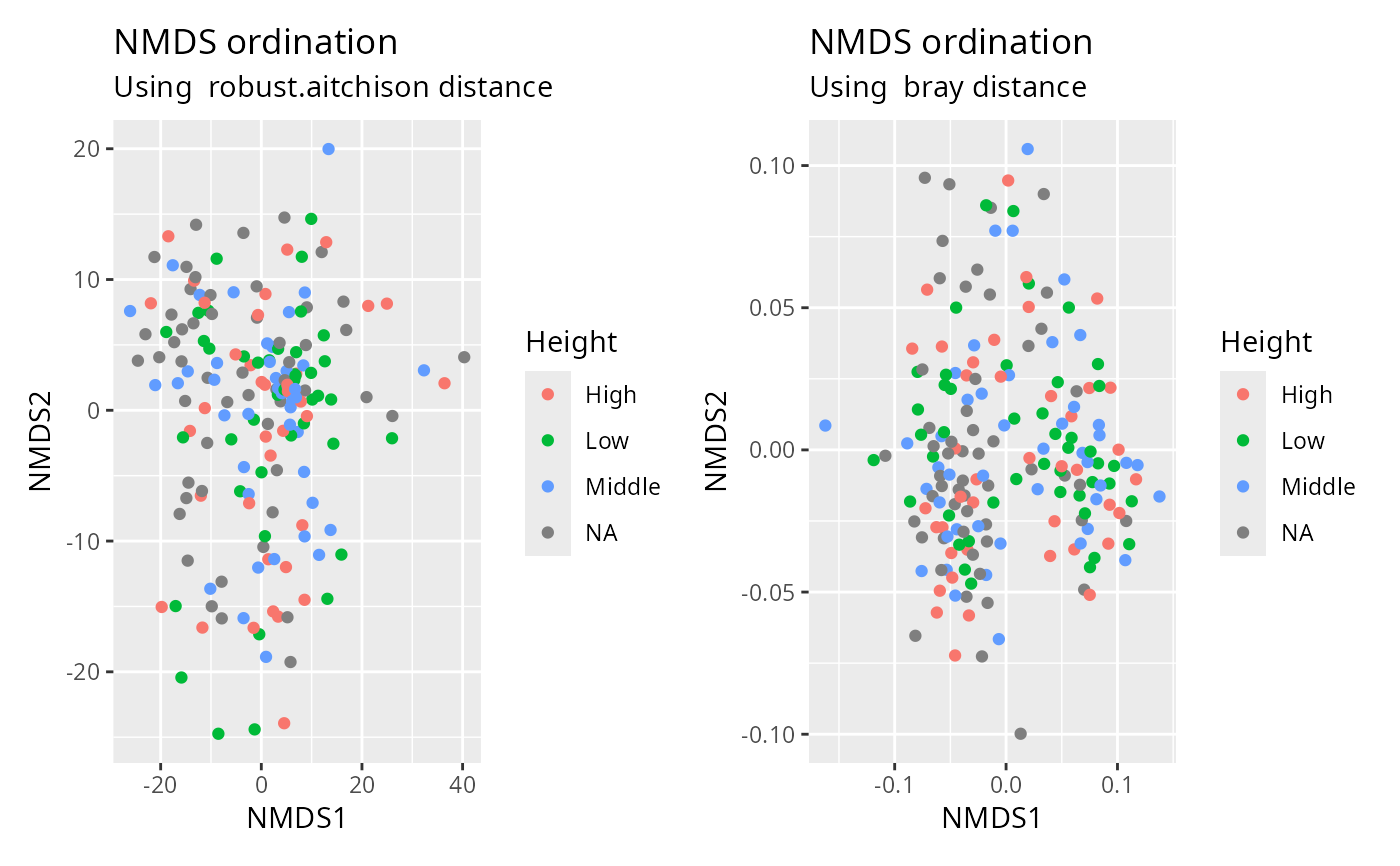
plot_ordination_pq(data_fungi_mini, method = "robust.aitchison", color = "Height") +
plot_ordination_pq(data_fungi_mini, method = "bray", color = "Height")
#> Taxa are now in columns.
#> Run 0 stress 0.115973
#> Run 1 stress 0.1325369
#> Run 2 stress 0.1266062
#> Run 3 stress 0.1159623
#> ... New best solution
#> ... Procrustes: rmse 0.001484698 max resid 0.01705622
#> Run 4 stress 0.4017493
#> Run 5 stress 0.1159623
#> ... New best solution
#> ... Procrustes: rmse 2.727712e-05 max resid 0.0002491861
#> ... Similar to previous best
#> Run 6 stress 0.1330352
#> Run 7 stress 0.1182422
#> Run 8 stress 0.1443908
#> Run 9 stress 0.1399469
#> Run 10 stress 0.1178904
#> Run 11 stress 0.1242026
#> Run 12 stress 0.4057599
#> Run 13 stress 0.1247709
#> Run 14 stress 0.1244501
#> Run 15 stress 0.1159624
#> ... Procrustes: rmse 8.367899e-05 max resid 0.0006713144
#> ... Similar to previous best
#> Run 16 stress 0.1300559
#> Run 17 stress 0.1266062
#> Run 18 stress 0.118866
#> Run 19 stress 0.1266066
#> Run 20 stress 0.1267024
#> *** Best solution repeated 2 times
#> Warning: `aes_string()` was deprecated in ggplot2 3.0.0.
#> ℹ Please use tidy evaluation idioms with `aes()`.
#> ℹ See also `vignette("ggplot2-in-packages")` for more information.
#> ℹ The deprecated feature was likely used in the phyloseq package.
#> Please report the issue at <https://github.com/joey711/phyloseq/issues>.
#> Taxa are now in columns.
#> Run 0 stress 0.1894178
#> Run 1 stress 0.1902982
#> Run 2 stress 0.1885288
#> ... New best solution
#> ... Procrustes: rmse 0.07195784 max resid 0.2513823
#> Run 3 stress 0.1906335
#> Run 4 stress 0.1886527
#> ... Procrustes: rmse 0.04927937 max resid 0.1896001
#> Run 5 stress 0.1884407
#> ... New best solution
#> ... Procrustes: rmse 0.05666386 max resid 0.2401529
#> Run 6 stress 0.1895027
#> Run 7 stress 0.188027
#> ... New best solution
#> ... Procrustes: rmse 0.04457651 max resid 0.209187
#> Run 8 stress 0.1902578
#> Run 9 stress 0.1894697
#> Run 10 stress 0.1911124
#> Run 11 stress 0.1901589
#> Run 12 stress 0.1889636
#> Run 13 stress 0.1894248
#> Run 14 stress 0.1909407
#> Run 15 stress 0.1891702
#> Run 16 stress 0.1870773
#> ... New best solution
#> ... Procrustes: rmse 0.0770278 max resid 0.2988579
#> Run 17 stress 0.1878373
#> Run 18 stress 0.189832
#> Run 19 stress 0.1898224
#> Run 20 stress 0.1885919
#> *** Best solution was not repeated -- monoMDS stopping criteria:
#> 14: no. of iterations >= maxit
#> 6: stress ratio > sratmax
 # \donttest{
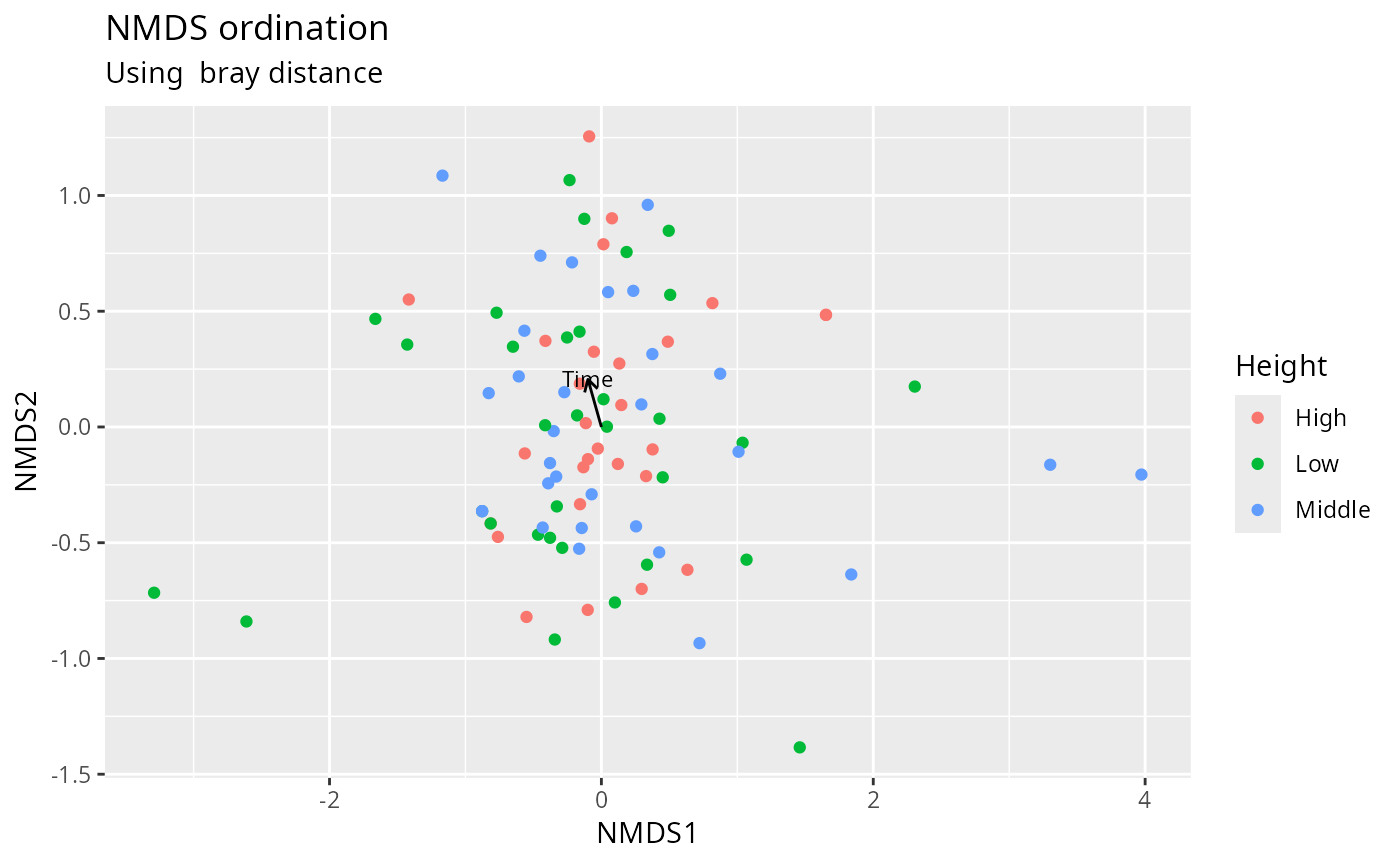
plot_ordination_pq(
subset_samples(data_fungi_mini, !is.na(Height)),
method = "bray",
color = "Height",
add_envfit = TRUE,
envfit_fact = "Time"
)
#> Taxa are now in columns.
#> Run 0 stress 0.1519287
#> Run 1 stress 0.1531429
#> Run 2 stress 0.1537355
#> Run 3 stress 0.1532178
#> Run 4 stress 0.1493505
#> ... New best solution
#> ... Procrustes: rmse 0.09344892 max resid 0.4339096
#> Run 5 stress 0.1518891
#> Run 6 stress 0.1496581
#> ... Procrustes: rmse 0.05159805 max resid 0.2239141
#> Run 7 stress 0.1494295
#> ... Procrustes: rmse 0.04119706 max resid 0.2142381
#> Run 8 stress 0.1514083
#> Run 9 stress 0.1520738
#> Run 10 stress 0.1524282
#> Run 11 stress 0.1502924
#> Run 12 stress 0.1540894
#> Run 13 stress 0.1495954
#> ... Procrustes: rmse 0.04991083 max resid 0.2124419
#> Run 14 stress 0.1534718
#> Run 15 stress 0.1518599
#> Run 16 stress 0.1520461
#> Run 17 stress 0.1509607
#> Run 18 stress 0.1529119
#> Run 19 stress 0.1502318
#> Run 20 stress 0.1528109
#> *** Best solution was not repeated -- monoMDS stopping criteria:
#> 20: no. of iterations >= maxit
# \donttest{
plot_ordination_pq(
subset_samples(data_fungi_mini, !is.na(Height)),
method = "bray",
color = "Height",
add_envfit = TRUE,
envfit_fact = "Time"
)
#> Taxa are now in columns.
#> Run 0 stress 0.1519287
#> Run 1 stress 0.1531429
#> Run 2 stress 0.1537355
#> Run 3 stress 0.1532178
#> Run 4 stress 0.1493505
#> ... New best solution
#> ... Procrustes: rmse 0.09344892 max resid 0.4339096
#> Run 5 stress 0.1518891
#> Run 6 stress 0.1496581
#> ... Procrustes: rmse 0.05159805 max resid 0.2239141
#> Run 7 stress 0.1494295
#> ... Procrustes: rmse 0.04119706 max resid 0.2142381
#> Run 8 stress 0.1514083
#> Run 9 stress 0.1520738
#> Run 10 stress 0.1524282
#> Run 11 stress 0.1502924
#> Run 12 stress 0.1540894
#> Run 13 stress 0.1495954
#> ... Procrustes: rmse 0.04991083 max resid 0.2124419
#> Run 14 stress 0.1534718
#> Run 15 stress 0.1518599
#> Run 16 stress 0.1520461
#> Run 17 stress 0.1509607
#> Run 18 stress 0.1529119
#> Run 19 stress 0.1502318
#> Run 20 stress 0.1528109
#> *** Best solution was not repeated -- monoMDS stopping criteria:
#> 20: no. of iterations >= maxit
 # }
# }