Plot the nucleotide proportion at both extremity of the sequences
Source:R/plot_functions.R
plot_refseq_extremity_pq.Rd
It is a useful function to check for the absence of unwanted patterns caused for example by Illumina adaptator or bad removal of primers.
If hill_scale is not null, Hill diversity number are used to represent the distribution
of the diversity (equitability) along the sequences.
Usage
plot_refseq_extremity_pq(
  physeq,
  first_n = 10,
  last_n = 10,
  q = c(1, 2),
  min_width = 0
)
Arguments
- physeq
(required) a
phyloseq-classobject obtained using thephyloseqpackage.- first_n
(int, default 10) The number of nucleotides to plot the 5' extremity.
- last_n
(int, default 10) The number of nucleotides to plot the 3' extremity.
- q
(vector) A vector defining the Hill number wanted. Set to NULL if you don't want to plot Hill diversity metrics. Hill numbers are more appropriate in DNA metabarcoding studies when
q > 0(Alberdi & Gilbert, 2019; Calderón-Sanou et al., 2019).- min_width
(int, default 0) Select only the sequences from physeq@refseq with using a minimum length threshold. If
first_nis superior to the minimum length of the references sequences, you must use min_width to filter out the narrower sequences
Value
A list of 4 objects
p_start and p_last are the ggplot object representing respectively the start and the end of the sequences.
df_start and df_last are the data.frame corresponding to the ggplot object.
Examples
data_f <- prune_samples(
sample_names(data_fungi_mini)[1:20],
data_fungi_mini
)
library("divent")
res1 <- plot_refseq_extremity_pq(data_f, q = 1)
names(res1)
#> [1] "plot_start" "plot_last" "df_start" "df_end"
# \donttest{
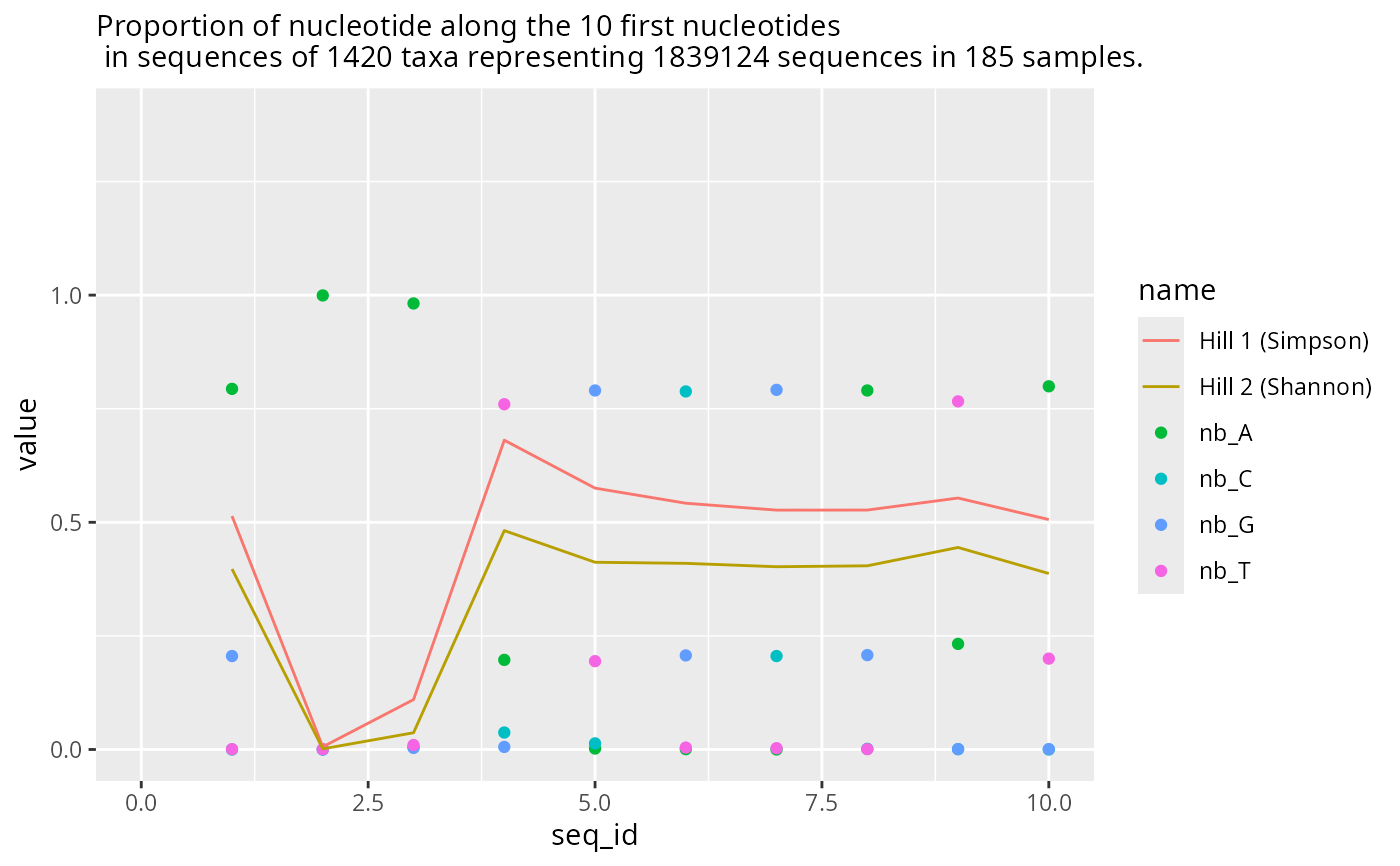
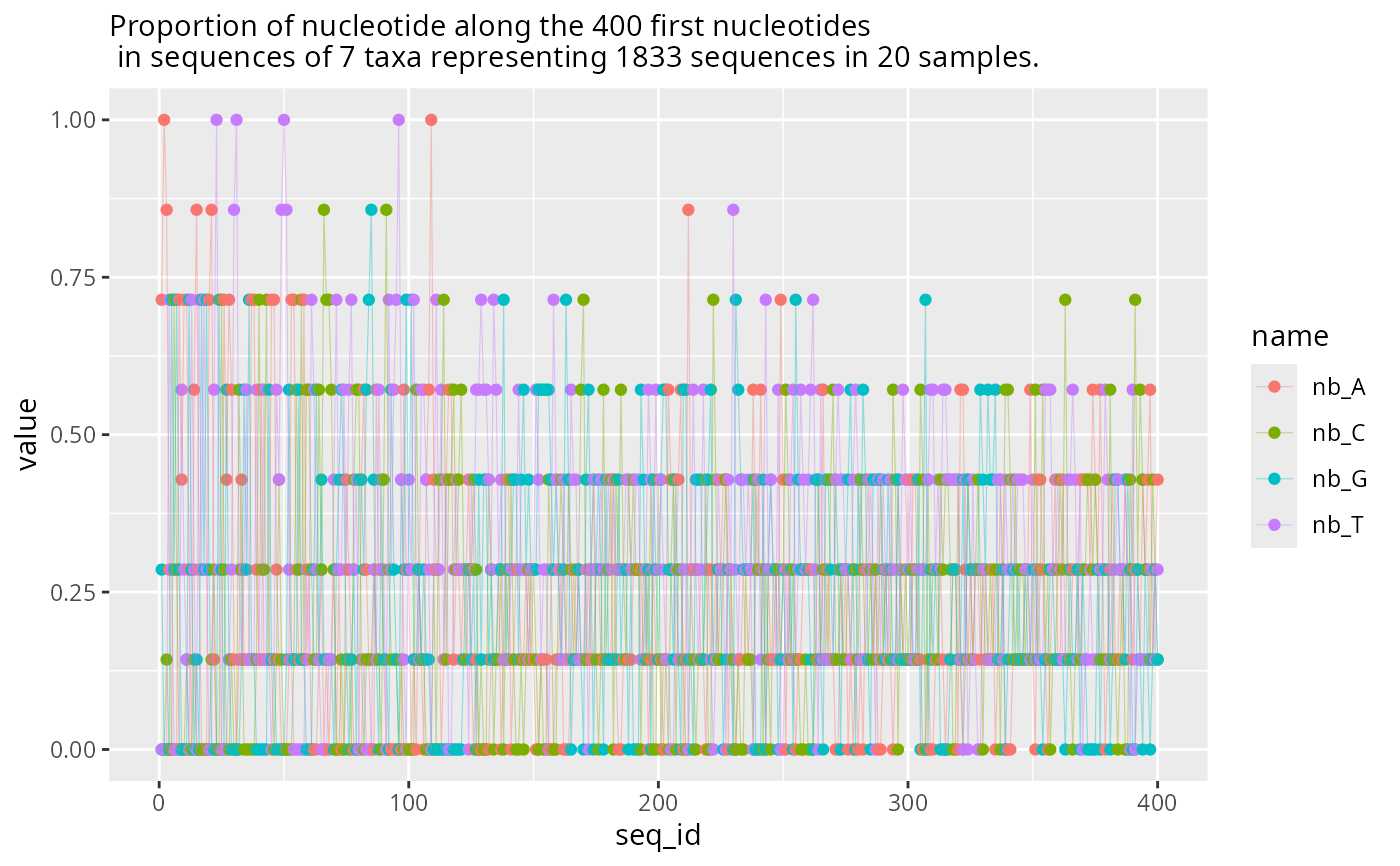
res1$plot_start
#> Warning: Removed 1508 rows containing missing values or values outside the scale range
#> (`geom_point()`).
#> Warning: Removed 377 rows containing missing values or values outside the scale range
#> (`geom_line()`).
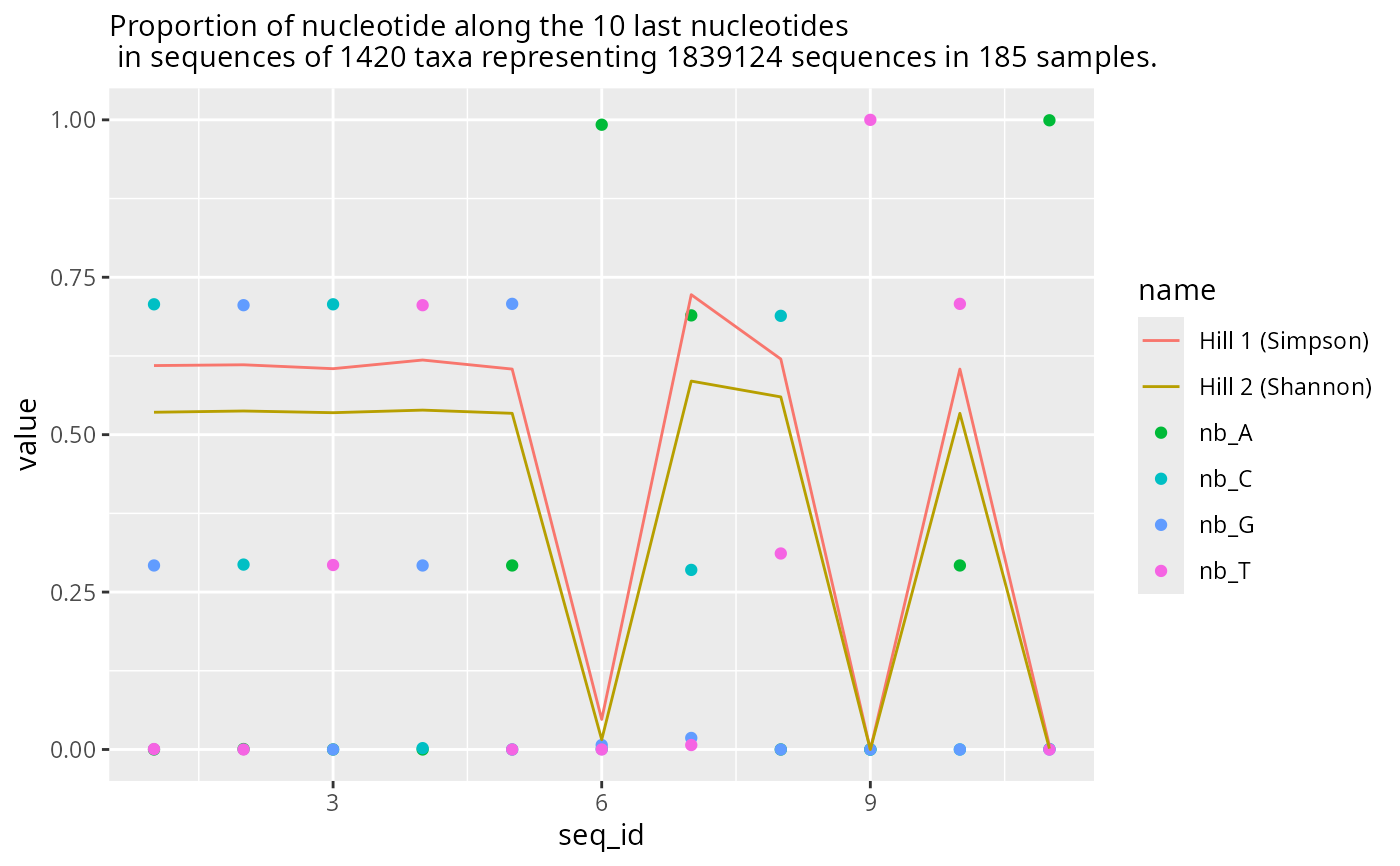
 res1$plot_last
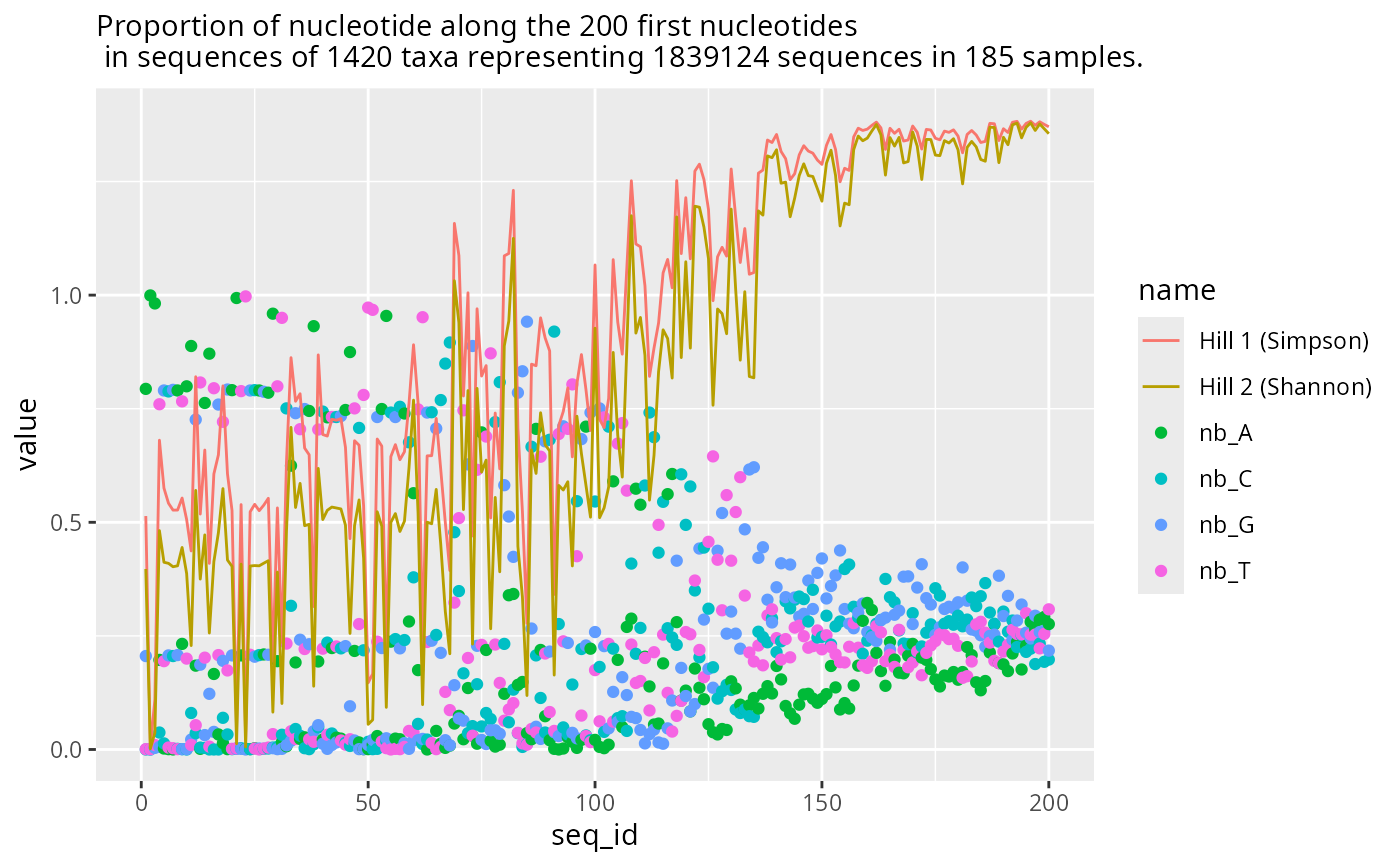
 res2 <- plot_refseq_extremity_pq(data_f, first_n = 200, last_n = 100)
res2$plot_start
#> Warning: Removed 748 rows containing missing values or values outside the scale range
#> (`geom_point()`).
#> Warning: Removed 374 rows containing missing values or values outside the scale range
#> (`geom_line()`).
res2 <- plot_refseq_extremity_pq(data_f, first_n = 200, last_n = 100)
res2$plot_start
#> Warning: Removed 748 rows containing missing values or values outside the scale range
#> (`geom_point()`).
#> Warning: Removed 374 rows containing missing values or values outside the scale range
#> (`geom_line()`).
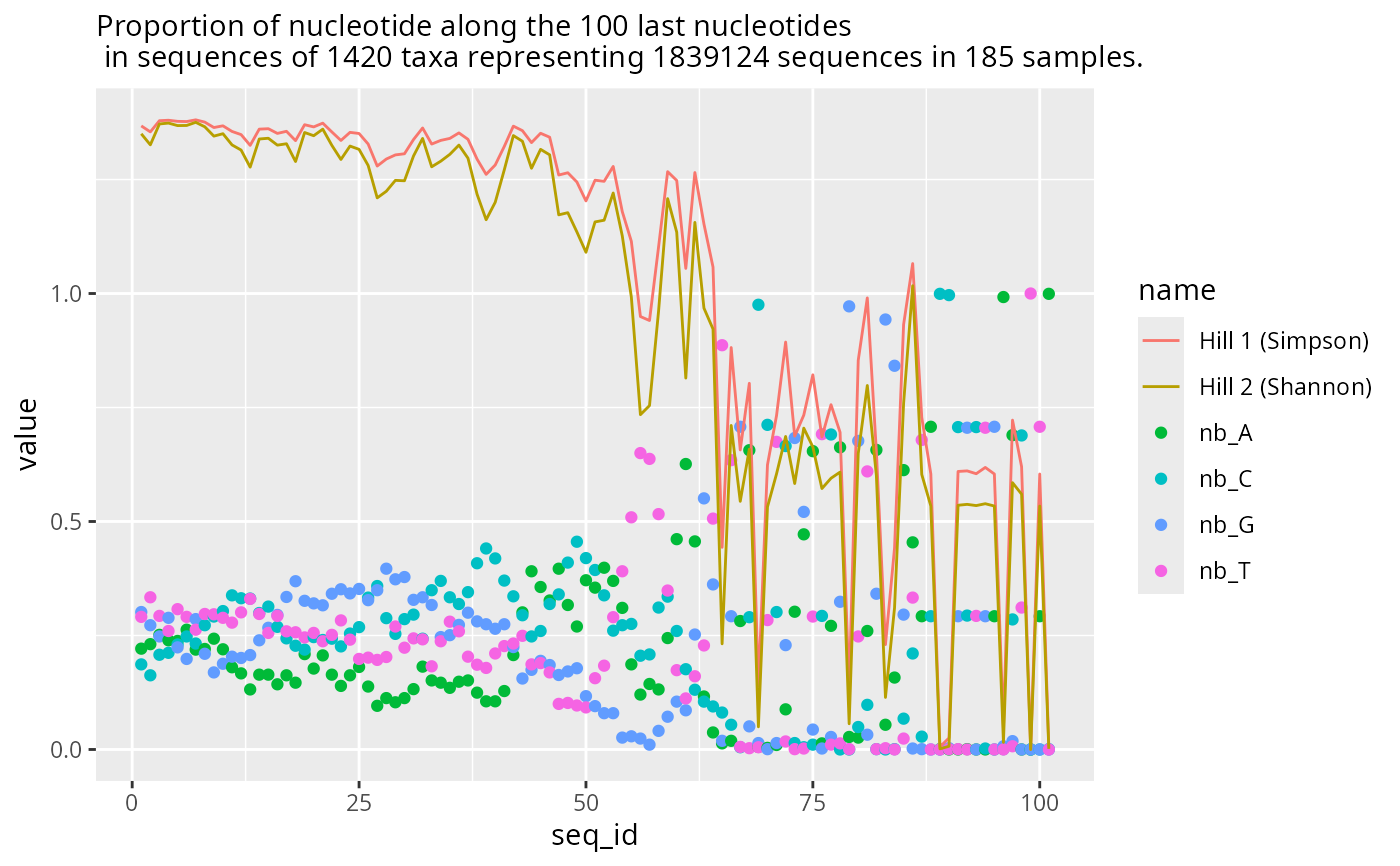
 res2$plot_last
 plot_refseq_extremity_pq(data_f,
first_n = NULL,
last_n = 200,
min_width = 200,
q = c(3)
)$plot_last
#> Cleaning suppress 16 taxa ( ASV32 / ASV35 / ASV50 / ASV53 / ASV54 / ASV58 / ASV61 / ASV63 / ASV68 / ASV72 / ASV75 / ASV77 / ASV82 / ASV99 / ASV100 / ASV108 ) and 0 sample(s) ( ).
#> Number of non-matching ASV 0
#> Number of matching ASV 45
#> Number of filtered-out ASV 16
#> Number of kept ASV 29
#> Number of kept samples 20
plot_refseq_extremity_pq(data_f,
first_n = NULL,
last_n = 200,
min_width = 200,
q = c(3)
)$plot_last
#> Cleaning suppress 16 taxa ( ASV32 / ASV35 / ASV50 / ASV53 / ASV54 / ASV58 / ASV61 / ASV63 / ASV68 / ASV72 / ASV75 / ASV77 / ASV82 / ASV99 / ASV100 / ASV108 ) and 0 sample(s) ( ).
#> Number of non-matching ASV 0
#> Number of matching ASV 45
#> Number of filtered-out ASV 16
#> Number of kept ASV 29
#> Number of kept samples 20
 # }
# }