A diagnostic plot of the number of sequences per samples
Source:R/plot_functions.R
plot_seq_ratio_pq.Rd
Arguments
- physeq
(required) a
phyloseq-classobject obtained using thephyloseqpackage.- min_nb_seq
(int) The minimum number of sequences per samples to compare the ratio.
- annotations
(logical, default TRUE). If FALSE, no annotations are plotted
Details
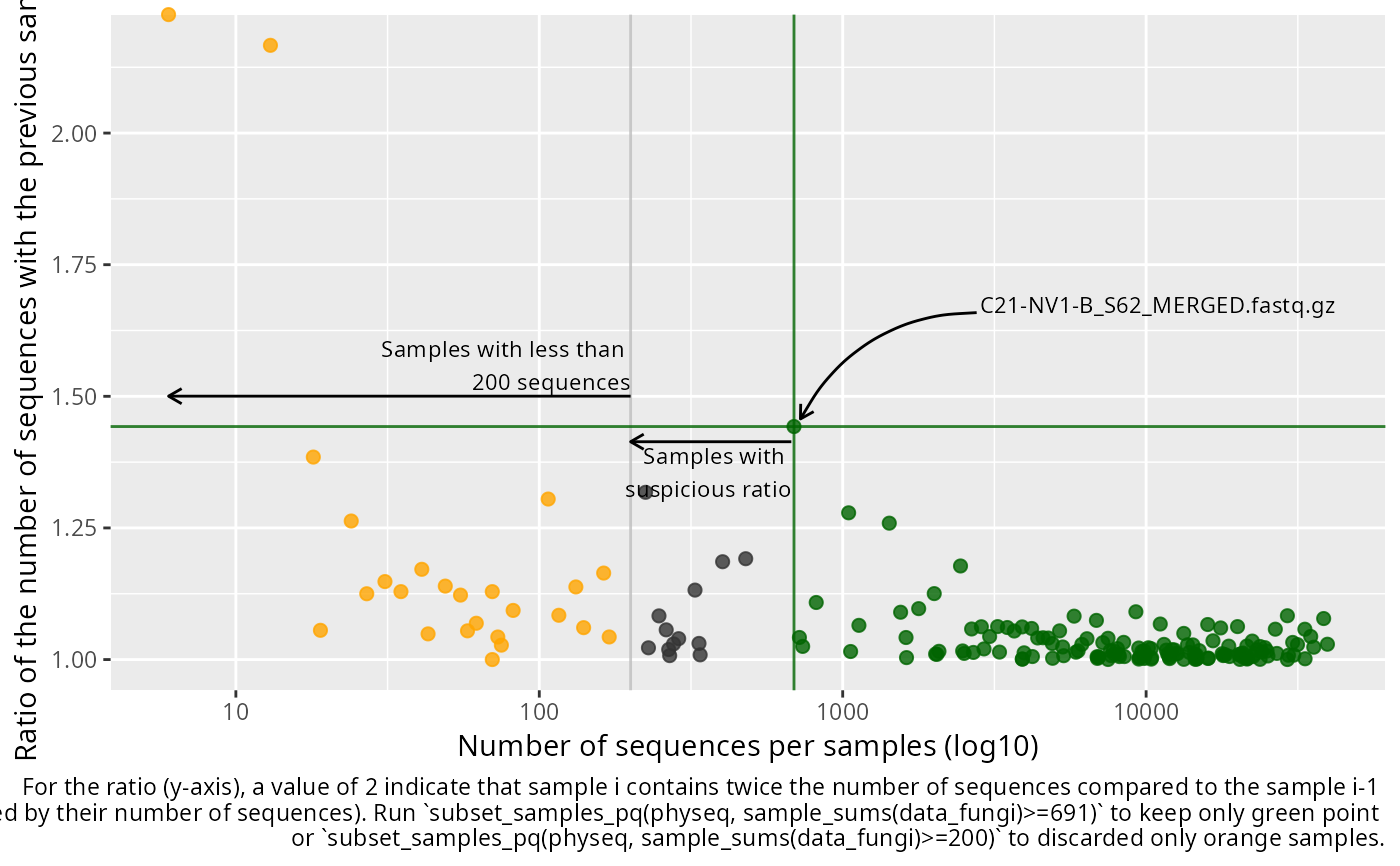
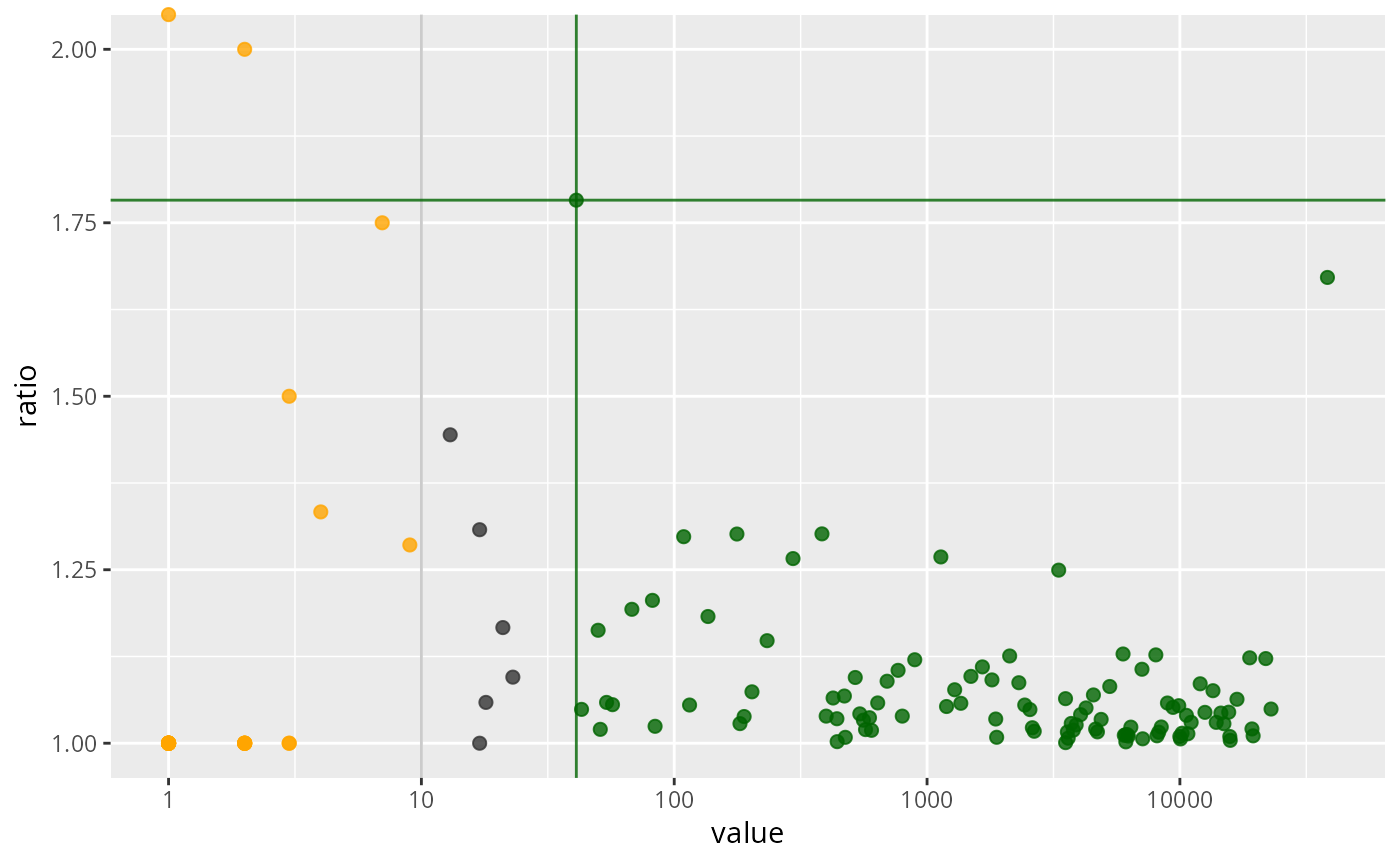
The x axis depict the number of sequences per samples and the y axis depicted the ratio of the number of sequences for a given sample divide by the number of sequences of the previous sample when ordered by the number of sequences. A high ratio indicate an important and quick increase of the number of sequence which may indicate that below this ratio, samples are suspicious.
The general idea is to first removed all samples with definitively not enough sequences and then, among the kept samples, find the higher augmentation (ratio) to possibly detect suspicious samples.
Examples
plot_seq_ratio_pq(data_fungi_mini, min_nb_seq = 10, annotations = FALSE)
 # \donttest{
plot_seq_ratio_pq(data_fungi, min_nb_seq = 200)
# \donttest{
plot_seq_ratio_pq(data_fungi, min_nb_seq = 200)
 data(GlobalPatterns)
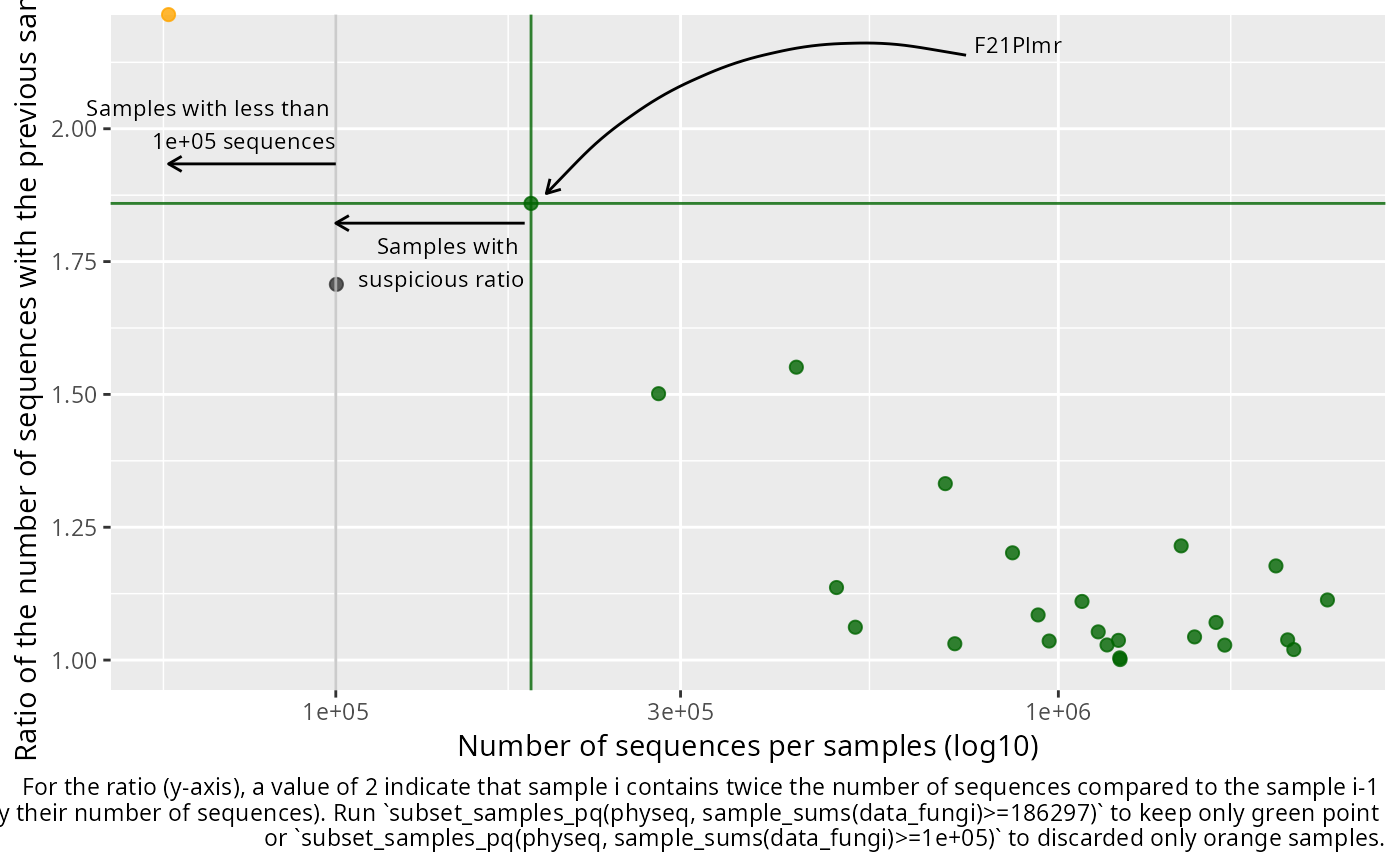
plot_seq_ratio_pq(GlobalPatterns, min_nb_seq = 100000)
data(GlobalPatterns)
plot_seq_ratio_pq(GlobalPatterns, min_nb_seq = 100000)
 # }
# }