Graphical representation of distribution of taxa across a factor using ridges.
Usage
ridges_pq(
  physeq,
  fact,
  nb_seq = TRUE,
  log10trans = TRUE,
  tax_level = "Class",
  type = "density",
  ...
)
Arguments
- physeq
(required) a
phyloseq-classobject obtained using thephyloseqpackage.- fact
(required) Name of the factor in
physeq@sam_dataused to plot different lines- nb_seq
(logical; default TRUE) If set to FALSE, only the number of ASV is count. Concretely, physeq
otu_tableis transformed in a binaryotu_table(each value different from zero is set to one)- log10trans
(logical, default TRUE) If TRUE, the number of sequences (or ASV if nb_seq = FALSE) is log10 transformed.
- tax_level
The taxonomic level to fill ridges
- type
Either "density" (the default) or "ecdf" to plot a plot a cumulative version using
ggplot2::stat_ecdf()- ...
Other params passed on to
ggridges::geom_density_ridges()
Value
A ggplot2 plot with bar representing the number of sequence en each
taxonomic groups
Examples
if (requireNamespace("ggridges")) {
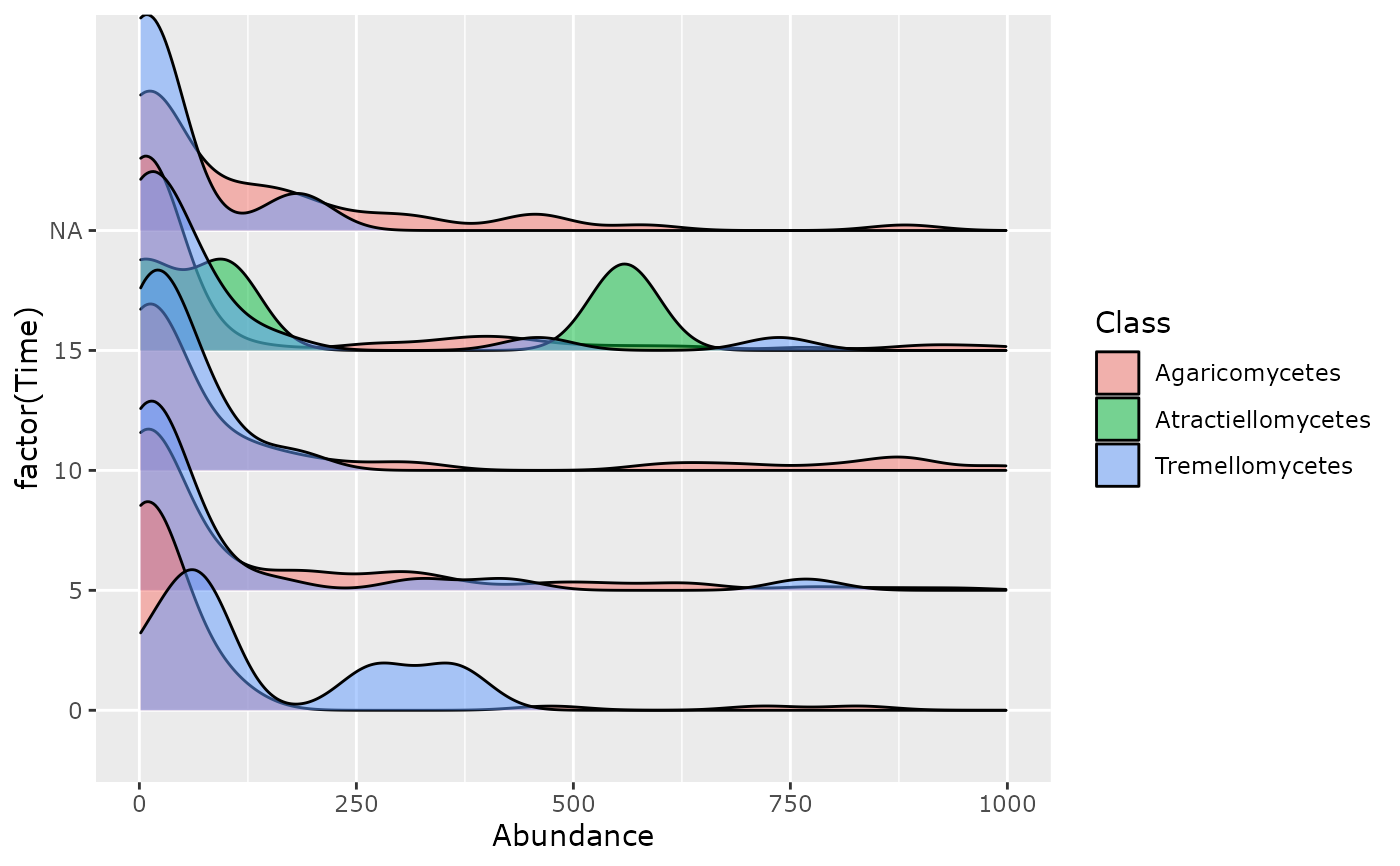
ridges_pq(data_fungi_mini, "Time", alpha = 0.5, log10trans = FALSE) + xlim(c(0, 1000))
}
#> Loading required namespace: ggridges
#> Scale for x is already present.
#> Adding another scale for x, which will replace the existing scale.
#> Picking joint bandwidth of 40.1
#> Warning: Removed 99 rows containing non-finite outside the scale range
#> (`stat_density_ridges()`).
 # \donttest{
if (requireNamespace("ggridges")) {
ridges_pq(data_fungi_mini, "Time", alpha = 0.5, scale = 0.9)
ridges_pq(data_fungi_mini, "Time", alpha = 0.5, scale = 0.9, type = "ecdf")
ridges_pq(data_fungi_mini, "Sample_names", log10trans = TRUE) + facet_wrap("~Height")
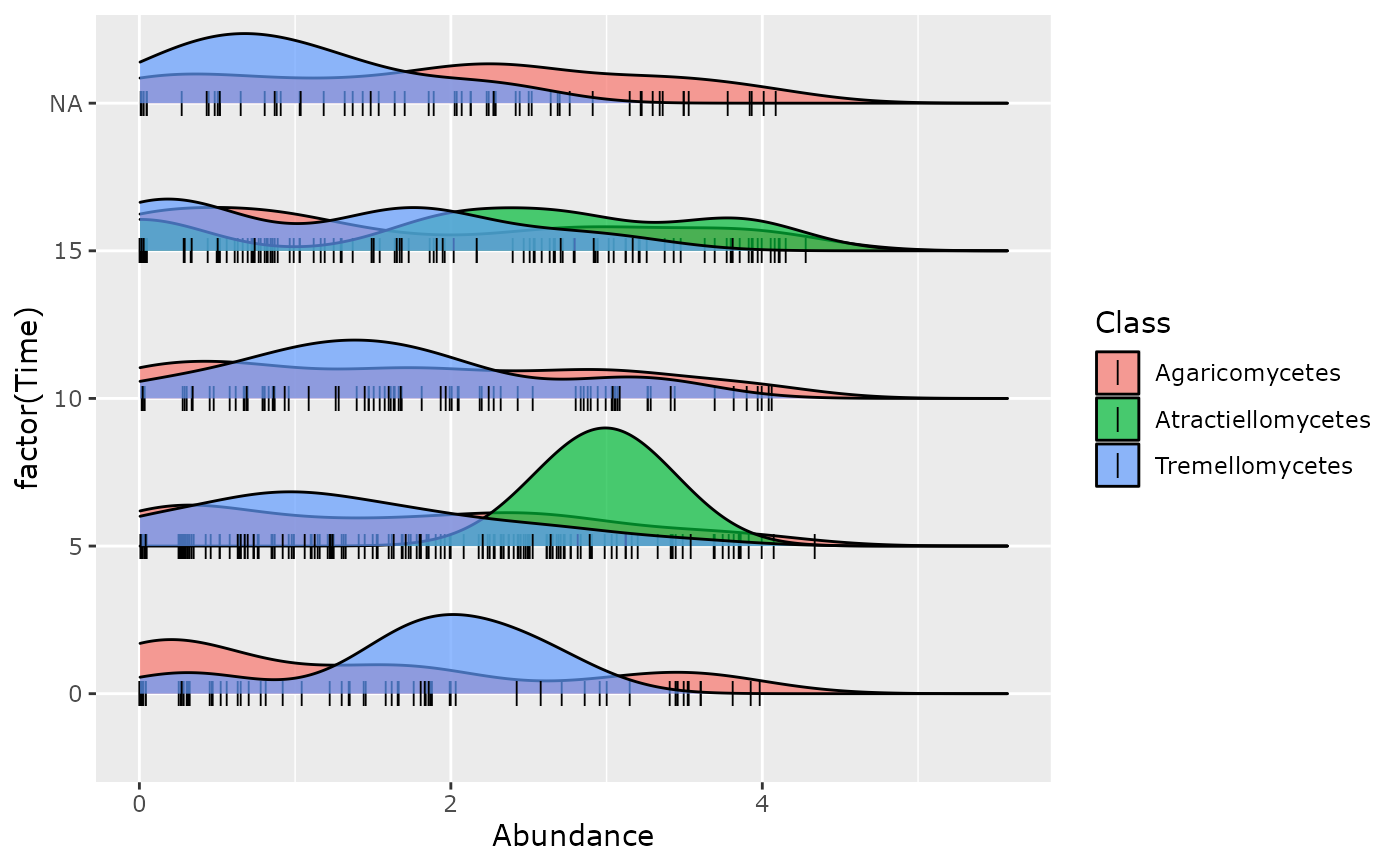
ridges_pq(data_fungi_mini,
"Time",
jittered_points = TRUE,
position = ggridges::position_points_jitter(width = 0.05, height = 0),
point_shape = "|", point_size = 3, point_alpha = 1, alpha = 0.7,
scale = 0.8
)
}
#> Picking joint bandwidth of 0.428
# \donttest{
if (requireNamespace("ggridges")) {
ridges_pq(data_fungi_mini, "Time", alpha = 0.5, scale = 0.9)
ridges_pq(data_fungi_mini, "Time", alpha = 0.5, scale = 0.9, type = "ecdf")
ridges_pq(data_fungi_mini, "Sample_names", log10trans = TRUE) + facet_wrap("~Height")
ridges_pq(data_fungi_mini,
"Time",
jittered_points = TRUE,
position = ggridges::position_points_jitter(width = 0.05, height = 0),
point_shape = "|", point_size = 3, point_alpha = 1, alpha = 0.7,
scale = 0.8
)
}
#> Picking joint bandwidth of 0.428
 # }
# }