Computes a manifold approximation and projection (UMAP) for phyloseq object
Source:R/plot_functions.R
umap_pq.Rd
https://journals.asm.org/doi/full/10.1128/msystems.00691-21
Arguments
- physeq
(required) a
phyloseq-classobject obtained using thephyloseqpackage.- pkg
Which R packages to use, either "umap" or "uwot".
- ...
Additional arguments passed on to
umap::umap()oruwot::umap2()function. For examplen_neighborsset the number of nearest neighbors (Default 15). Seeumap::umap.defaults()oruwot::umap2()for the list of parameters and default values.
Details
This function is mainly a wrapper of the work of others.
Please make a reference to umap::umap() if you
use this function.
Examples
library("umap")
data_f <- prune_samples(
sample_names(data_fungi_mini)[1:20],
data_fungi_mini
)
df_umap <- umap_pq(data_f, n_neighbors = 3)
#> Taxa are now in columns.
#> Taxa are now in rows.
#> Joining with `by = join_by(Sample)`
#> Joining with `by = join_by(Sample)`
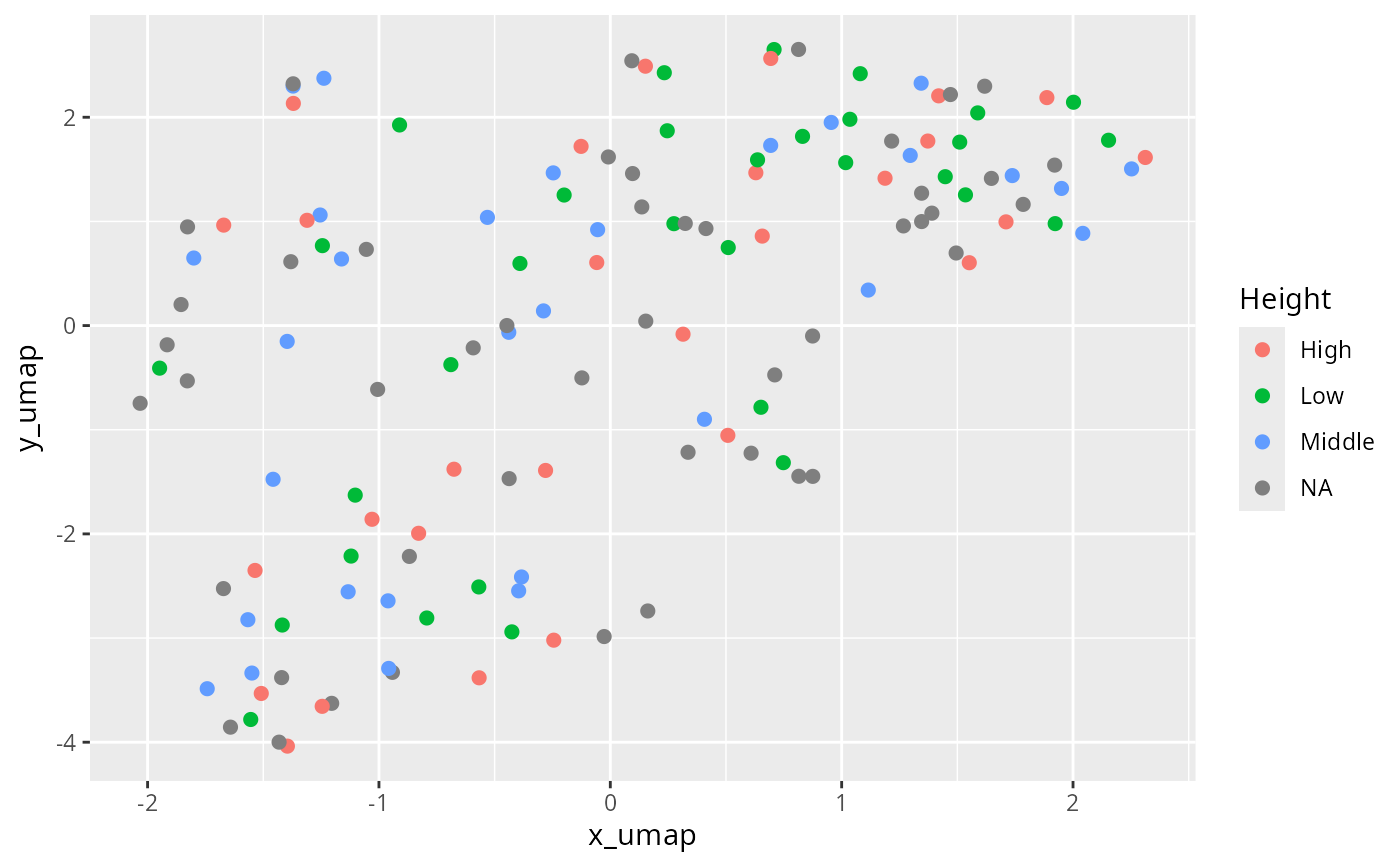
ggplot(df_umap, aes(x = x_umap, y = y_umap, col = Height)) +
geom_point(size = 2)
 if (FALSE) { # \dontrun{
df_uwot <- umap_pq(data_fungi_mini, pkg = "uwot")
library(patchwork)
physeq <- data_fungi_mini
df_umap <- umap_pq(physeq, n_neighbors = 3)
res_tsne <- tsne_pq(data_fungi_mini)
df_umap_tsne <- df_umap
df_umap_tsne$x_tsne <- res_tsne$Y[, 1]
df_umap_tsne$y_tsne <- res_tsne$Y[, 2]
((ggplot(df_umap, aes(x = x_umap, y = y_umap, col = Height)) +
geom_point(size = 2) +
ggtitle("UMAP")) +
(plot_ordination(physeq,
ordination = ordinate(physeq, method = "PCoA", distance = "bray"),
color = "Height"
) + ggtitle("PCoA"))) /
((ggplot(df_umap_tsne, aes(x = x_tsne, y = y_tsne, col = Height)) +
geom_point(size = 2) +
ggtitle("tsne")) +
(plot_ordination(physeq,
ordination = ordinate(physeq, method = "NMDS", distance = "bray"),
color = "Height"
) + ggtitle("NMDS"))) +
patchwork::plot_layout(guides = "collect")
(ggplot(df_umap, aes(x = x_umap, y = y_umap, col = Height)) +
geom_point(size = 2) +
ggtitle("umap::umap")) /
(ggplot(df_uwot, aes(x = x_umap, y = y_umap, col = Height)) +
geom_point(size = 2) +
ggtitle("uwot::umap2"))
} # }
if (FALSE) { # \dontrun{
df_uwot <- umap_pq(data_fungi_mini, pkg = "uwot")
library(patchwork)
physeq <- data_fungi_mini
df_umap <- umap_pq(physeq, n_neighbors = 3)
res_tsne <- tsne_pq(data_fungi_mini)
df_umap_tsne <- df_umap
df_umap_tsne$x_tsne <- res_tsne$Y[, 1]
df_umap_tsne$y_tsne <- res_tsne$Y[, 2]
((ggplot(df_umap, aes(x = x_umap, y = y_umap, col = Height)) +
geom_point(size = 2) +
ggtitle("UMAP")) +
(plot_ordination(physeq,
ordination = ordinate(physeq, method = "PCoA", distance = "bray"),
color = "Height"
) + ggtitle("PCoA"))) /
((ggplot(df_umap_tsne, aes(x = x_tsne, y = y_tsne, col = Height)) +
geom_point(size = 2) +
ggtitle("tsne")) +
(plot_ordination(physeq,
ordination = ordinate(physeq, method = "NMDS", distance = "bray"),
color = "Height"
) + ggtitle("NMDS"))) +
patchwork::plot_layout(guides = "collect")
(ggplot(df_umap, aes(x = x_umap, y = y_umap, col = Height)) +
geom_point(size = 2) +
ggtitle("umap::umap")) /
(ggplot(df_uwot, aes(x = x_umap, y = y_umap, col = Height)) +
geom_point(size = 2) +
ggtitle("uwot::umap2"))
} # }