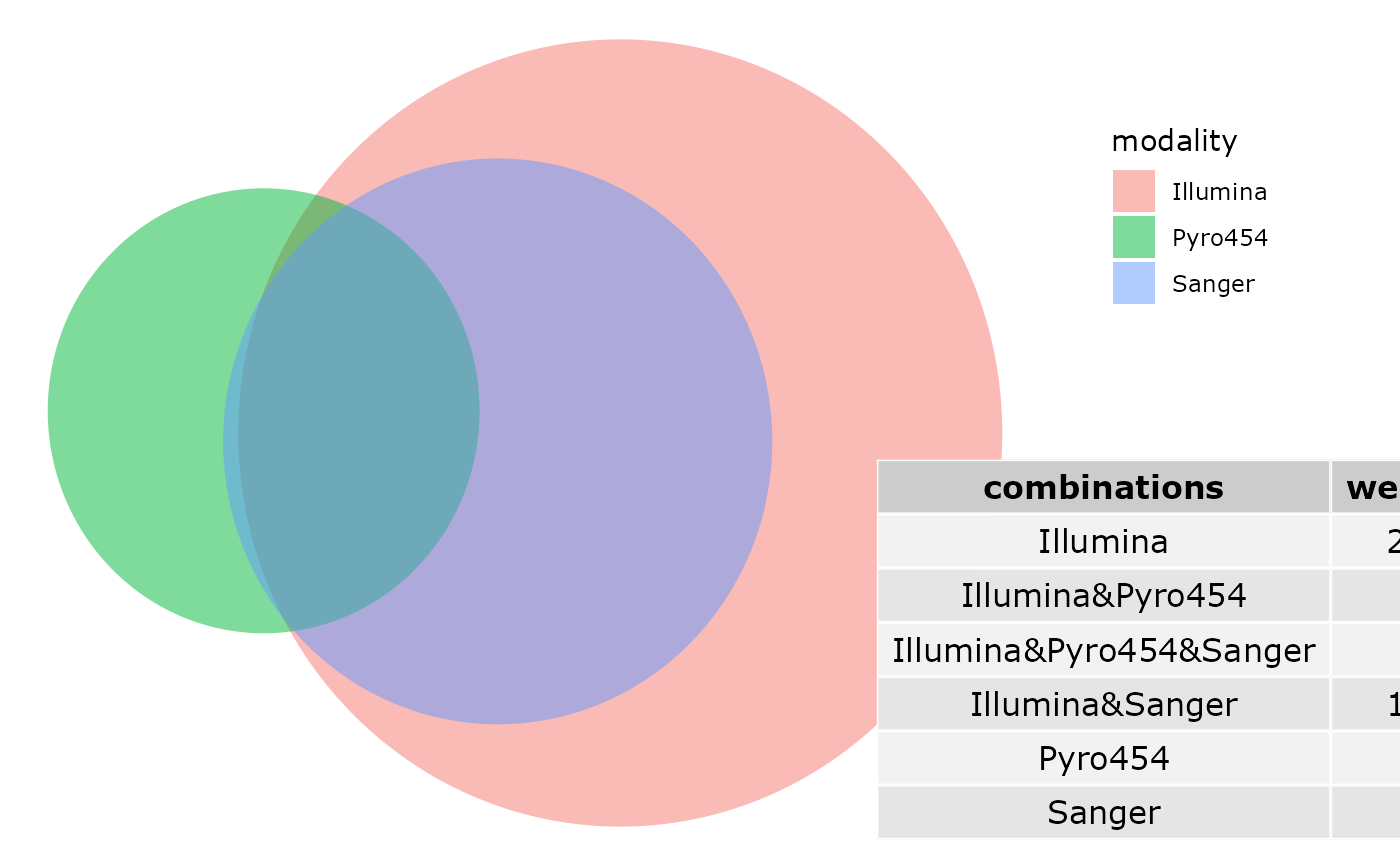
Graphical representation of distribution of taxa across combined modality of a factor.
Arguments
- physeq
(required) a
phyloseq-classobject obtained using thephyloseqpackage.- fact
(required) Name of the factor to cluster samples by modalities. Need to be in
physeq@sam_data.- min_nb_seq
(default: 0) minimum number of sequences by OTUs by samples to take into count this OTUs in this sample. For example, if min_nb_seq=2,each value of 2 or less in the OTU table will be change into 0 for the analysis
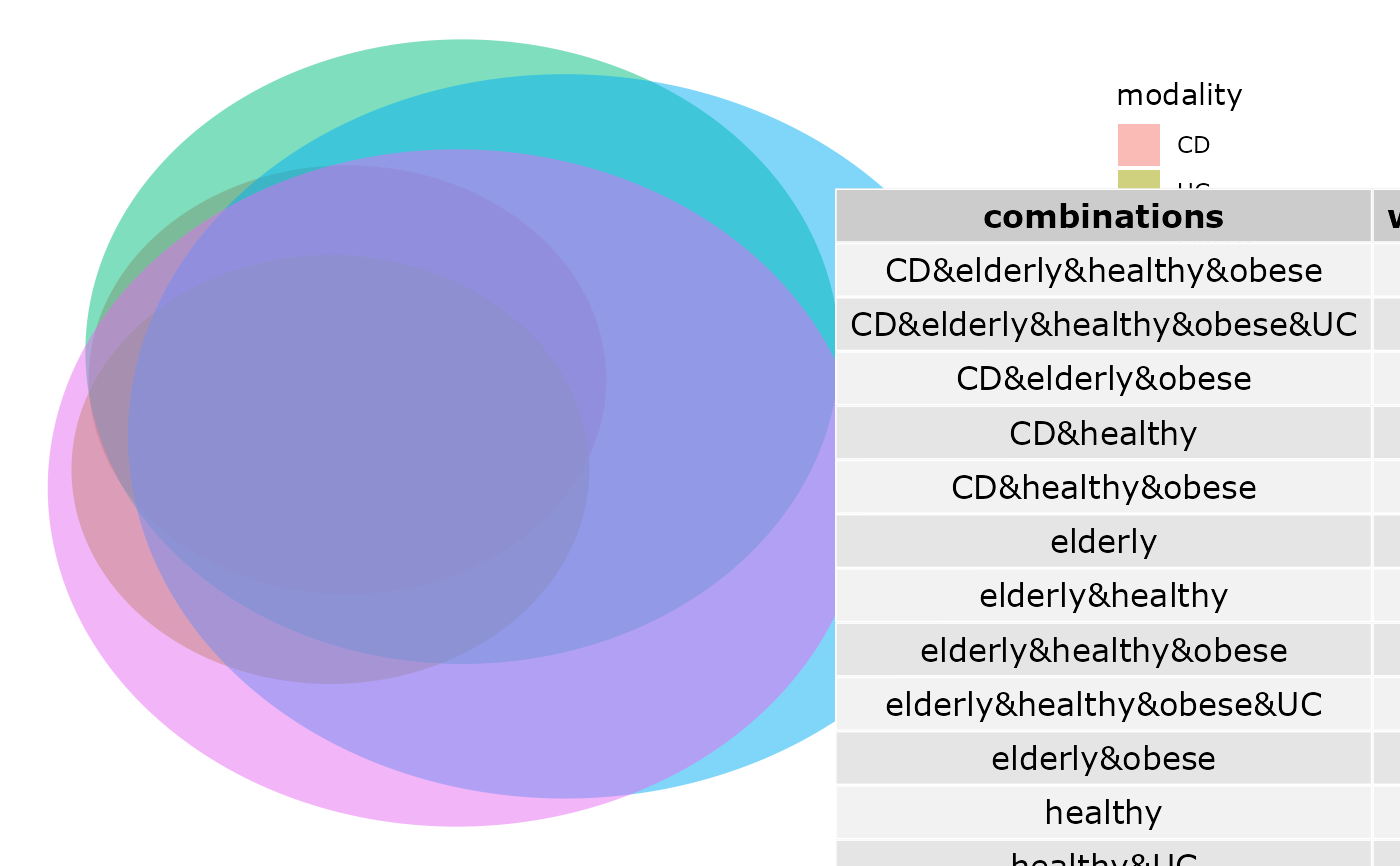
- print_values
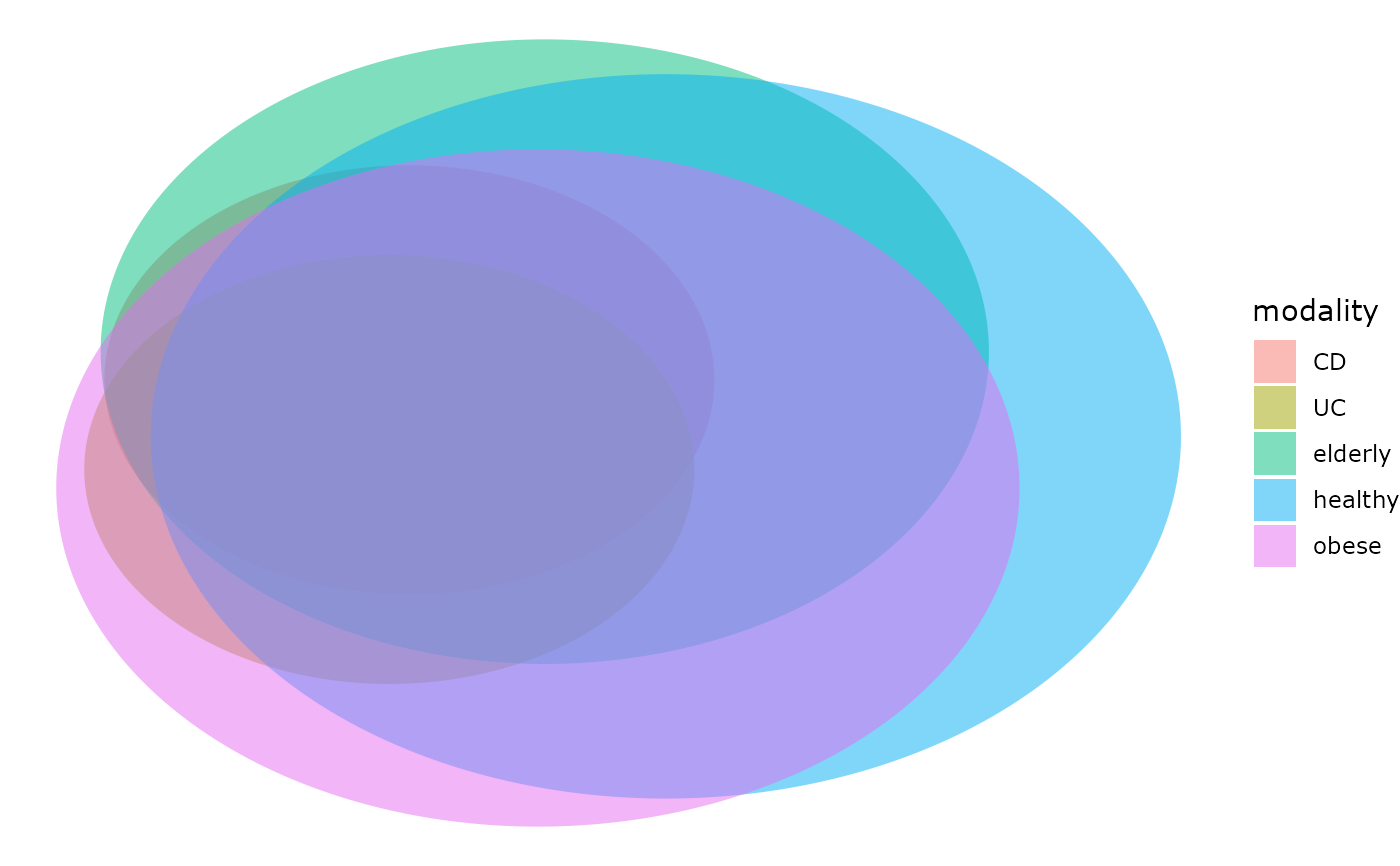
(logical) Print (or not) the table of number of OTUs for each combination. If print_values is TRUE the object is not a ggplot object. Please use print_values = FALSE if you want to add ggplot function (cf example).
Value
A ggplot2 plot representing Venn diagram of
modalities of the argument factor
Examples
if (requireNamespace("venneuler")) {
data("enterotype")
venn_pq(enterotype, fact = "SeqTech")
}
#> Loading required namespace: venneuler
 # \donttest{
if (requireNamespace("venneuler")) {
venn_pq(enterotype, fact = "ClinicalStatus")
venn_pq(enterotype, fact = "Nationality", print_values = FALSE)
venn_pq(enterotype, fact = "ClinicalStatus", print_values = FALSE) +
scale_fill_hue()
venn_pq(enterotype, fact = "ClinicalStatus", print_values = FALSE) +
scale_fill_hue()
}
# \donttest{
if (requireNamespace("venneuler")) {
venn_pq(enterotype, fact = "ClinicalStatus")
venn_pq(enterotype, fact = "Nationality", print_values = FALSE)
venn_pq(enterotype, fact = "ClinicalStatus", print_values = FALSE) +
scale_fill_hue()
venn_pq(enterotype, fact = "ClinicalStatus", print_values = FALSE) +
scale_fill_hue()
}
 # }
# }