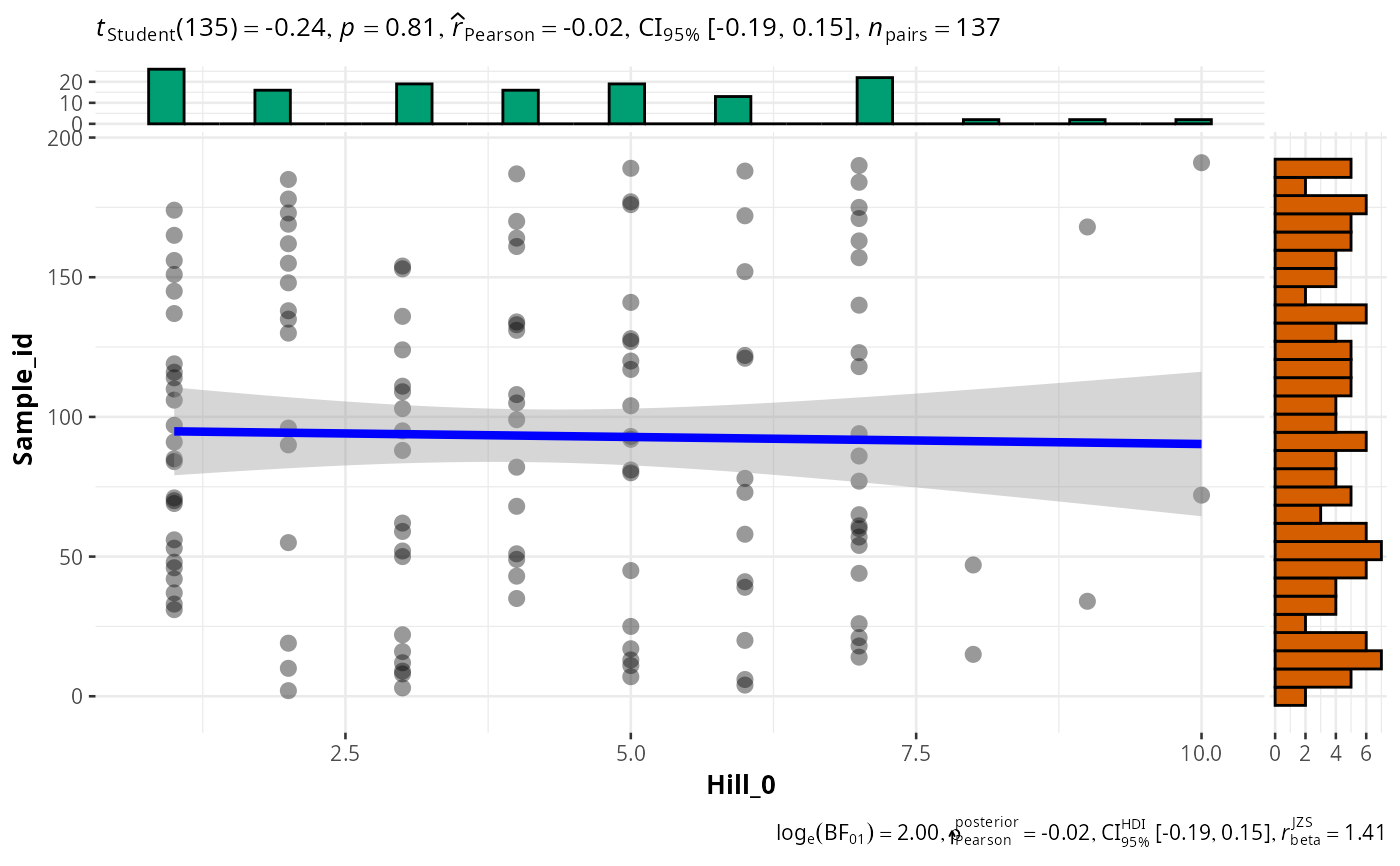
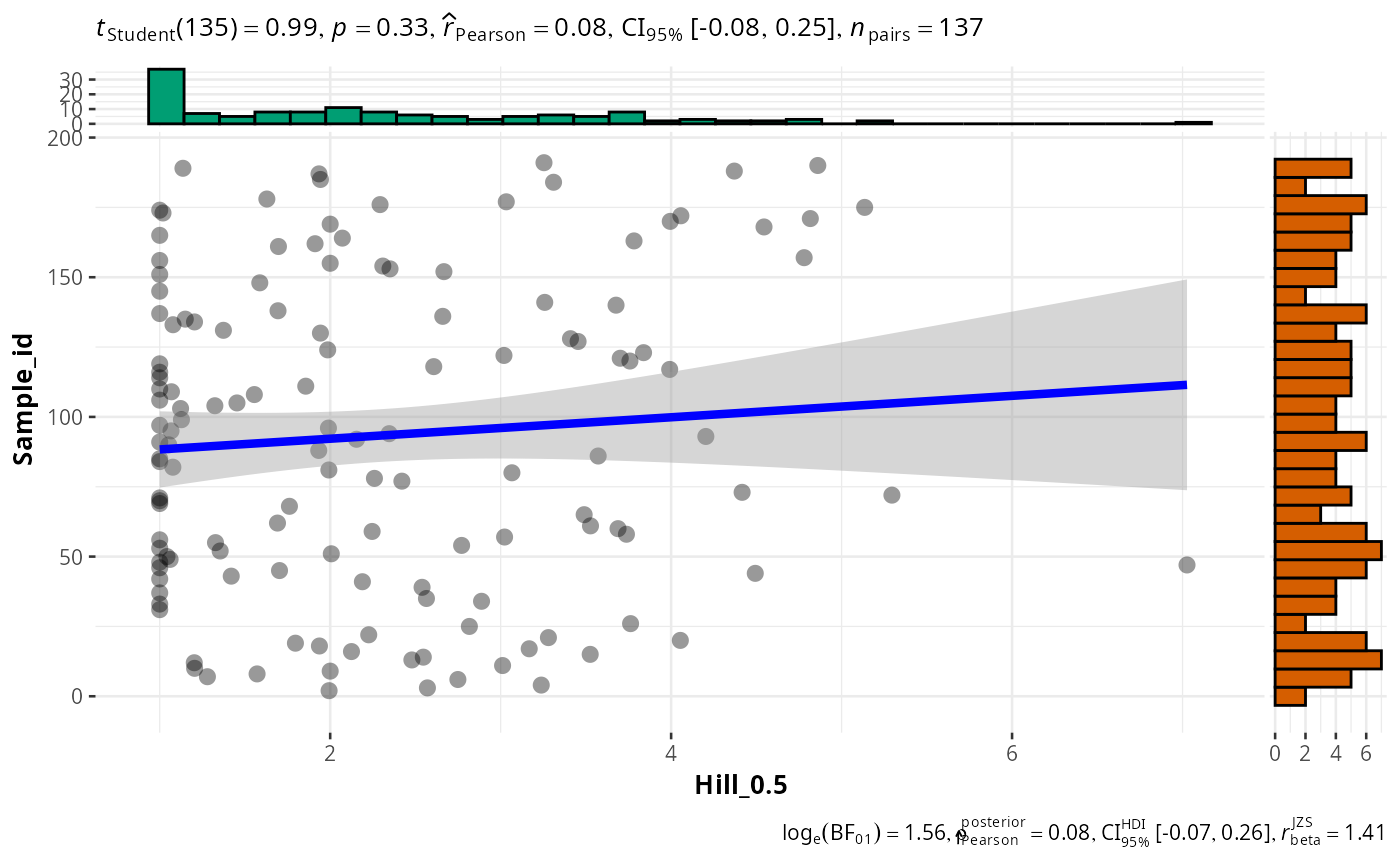
Scatterplot with marginal distributions and statistical results against Hill diversity of phyloseq object
Source:R/plot_functions.R
ggscatt_pq.Rd
Basically a wrapper of function ggstatsplot::ggscatterstats() for
object of class phyloseq and Hill number.
Usage
ggscatt_pq(
  physeq,
  num_modality,
  q = c(0, 1, 2),
  rarefy_by_sample = FALSE,
  rngseed = FALSE,
  verbose = TRUE,
  one_plot = TRUE,
  ...
)
Arguments
- physeq
(required) a
phyloseq-classobject obtained using thephyloseqpackage.- num_modality
(required) Name of the numeric column in
physeq@sam_datato plot and test against hill number- q
(a vector of integer) The list of q values to compute the hill number H^q. If Null, no hill number are computed. Default value compute the Hill number 0 (Species richness), the Hill number 1 (exponential of Shannon Index) and the Hill number 2 (inverse of Simpson Index). Hill numbers are more appropriate in DNA metabarcoding studies when
q > 0(Alberdi & Gilbert, 2019; Calderón-Sanou et al., 2019).- rarefy_by_sample
(logical, default FALSE) If TRUE, rarefy samples using
phyloseq::rarefy_even_depth()function.- rngseed
(Optional). A single integer value passed to
phyloseq::rarefy_even_depth(), which is used to fix a seed for reproducibly random number generation (in this case, reproducibly random subsampling). If set to FALSE, then no fiddling with the RNG seed is performed, and it is up to the user to appropriately call set.seed beforehand to achieve reproducible results. Default is FALSE.- verbose
(logical). If TRUE, print additional information.
- one_plot
(logical, default FALSE) If TRUE, return a unique plot with the three plot inside using the patchwork package.
- ...
Additional arguments passed on to
ggstatsplot::ggscatterstats()function.
Details
This function is mainly a wrapper of the work of others.
Please make a reference to ggstatsplot::ggscatterstats() if you
use this function.
Examples
if (requireNamespace("ggstatsplot")) {
library("divent")
ggscatt_pq(data_fungi_mini, "Time", q = 0, type = "non-parametric")
}
#> Taxa are now in columns.
#> Taxa are now in rows.
#> ! Sample coverage is 0, most estimators will return `NaN`.
#> ! Sample coverage is 0, most estimators will return `NaN`.
#> Joining with `by = join_by(Sample)`
 # \donttest{
if (requireNamespace("ggstatsplot")) {
ggscatt_pq(data_fungi_mini, "Sample_id",
q = 0,
one_plot = FALSE
)
}
#> Taxa are now in columns.
#> Taxa are now in rows.
#> ! Sample coverage is 0, most estimators will return `NaN`.
#> ! Sample coverage is 0, most estimators will return `NaN`.
#> Joining with `by = join_by(Sample)`
#> [[1]]
# \donttest{
if (requireNamespace("ggstatsplot")) {
ggscatt_pq(data_fungi_mini, "Sample_id",
q = 0,
one_plot = FALSE
)
}
#> Taxa are now in columns.
#> Taxa are now in rows.
#> ! Sample coverage is 0, most estimators will return `NaN`.
#> ! Sample coverage is 0, most estimators will return `NaN`.
#> Joining with `by = join_by(Sample)`
#> [[1]]
 #>
# }
#>
# }