Plot the partition the variation of a phyloseq object
Source:R/plot_functions.R
plot_var_part_pq.RdGraphical representation of the partition of variation obtain with var_par_pq().
Usage
plot_var_part_pq(
  res_varpart,
  cutoff = 0,
  digits = 1,
  digits_quantile = 2,
  fill_bg = c("seagreen3", "mediumpurple", "blue", "orange"),
  show_quantiles = FALSE,
  filter_quantile_zero = TRUE,
  show_dbrda_signif = FALSE,
  show_dbrda_signif_pval = 0.05,
  alpha = 63,
  id.size = 1.2,
  min_prop_pval_signif_dbrda = 0.95
)
Arguments
- res_varpart
(required) the result of the functions
var_par_pq()orvar_par_rarperm_pq()- cutoff
The values below cutoff will not be displayed.
- digits
The number of significant digits.
- digits_quantile
The number of significant digits for quantile.
- fill_bg
Fill colours of ellipses.
- show_quantiles
Do quantiles are printed ?
- filter_quantile_zero
Do we filter out value with quantile encompassing the zero value?
- show_dbrda_signif
Do dbrda significance for each component is printed using *?
- show_dbrda_signif_pval
(float,
[0:1]) The value under which the dbrda is considered significant.- alpha
(int,
[0:255]) Transparency of the fill colour.- id.size
A numerical value giving the character expansion factor for the names of circles or ellipses.
- min_prop_pval_signif_dbrda
(float,
[0:1]) Only used if using the result ofvar_par_rarperm_pq()function. The * for dbrda_signif is only add if at leastmin_prop_pval_signif_dbrdaof permutations show significance.
Details
This function is mainly a wrapper of the work of others.
Please make a reference to vegan::varpart() if you
use this function.
Examples
# \donttest{
if (requireNamespace("vegan")) {
  data_fungi_woNA <- subset_samples(data_fungi, !is.na(Time) & !is.na(Height))
  res_var_9 <- var_par_rarperm_pq(
    data_fungi_woNA,
    list_component = list(
      "Time" = c("Time"),
      "Size" = c("Height", "Diameter")
    ),
    nperm = 9,
    dbrda_computation = TRUE
  )
  res_var_2 <- var_par_rarperm_pq(
    data_fungi_woNA,
    list_component = list(
      "Time" = c("Time"),
      "Size" = c("Height", "Diameter")
    ),
    nperm = 2,
    dbrda_computation = TRUE
  )
  res_var0 <- var_par_pq(data_fungi_woNA,
    list_component = list(
      "Time" = c("Time"),
      "Size" = c("Height", "Diameter")
    ),
    dbrda_computation = TRUE
  )
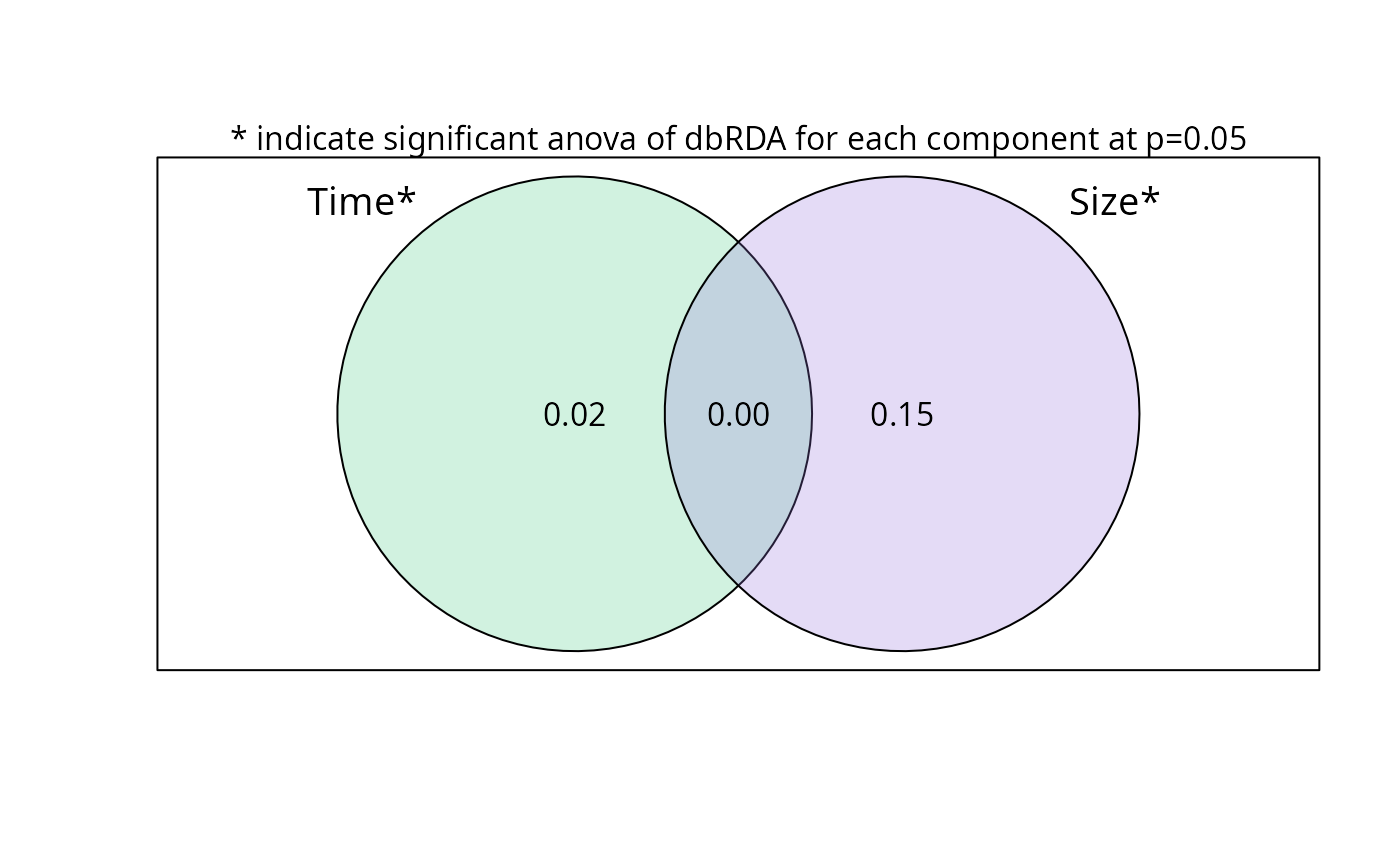
  plot_var_part_pq(res_var0, digits_quantile = 2, show_dbrda_signif = TRUE)
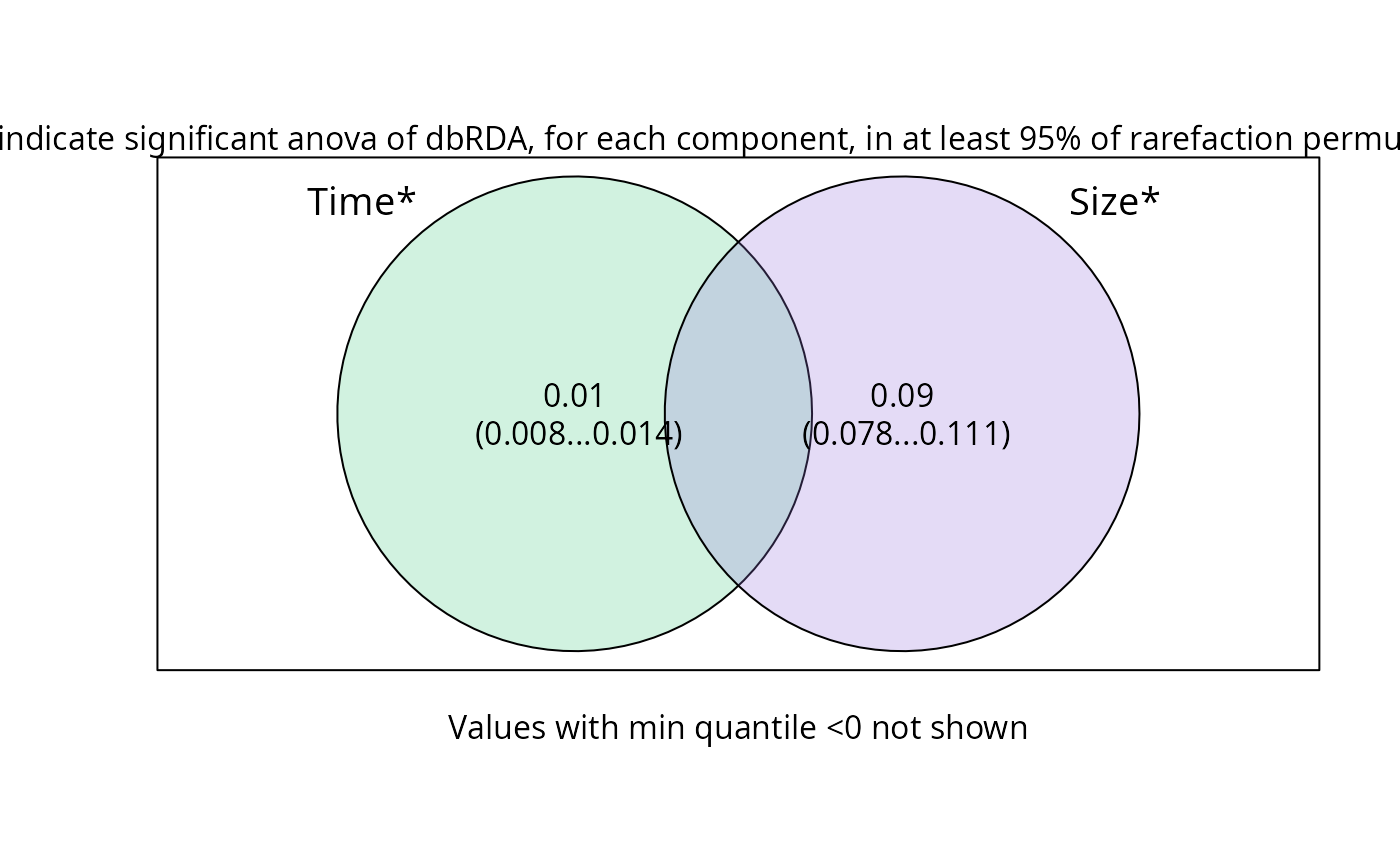
  plot_var_part_pq(res_var_9,
    digits_quantile = 2, show_quantiles = TRUE,
    show_dbrda_signif = TRUE
  )
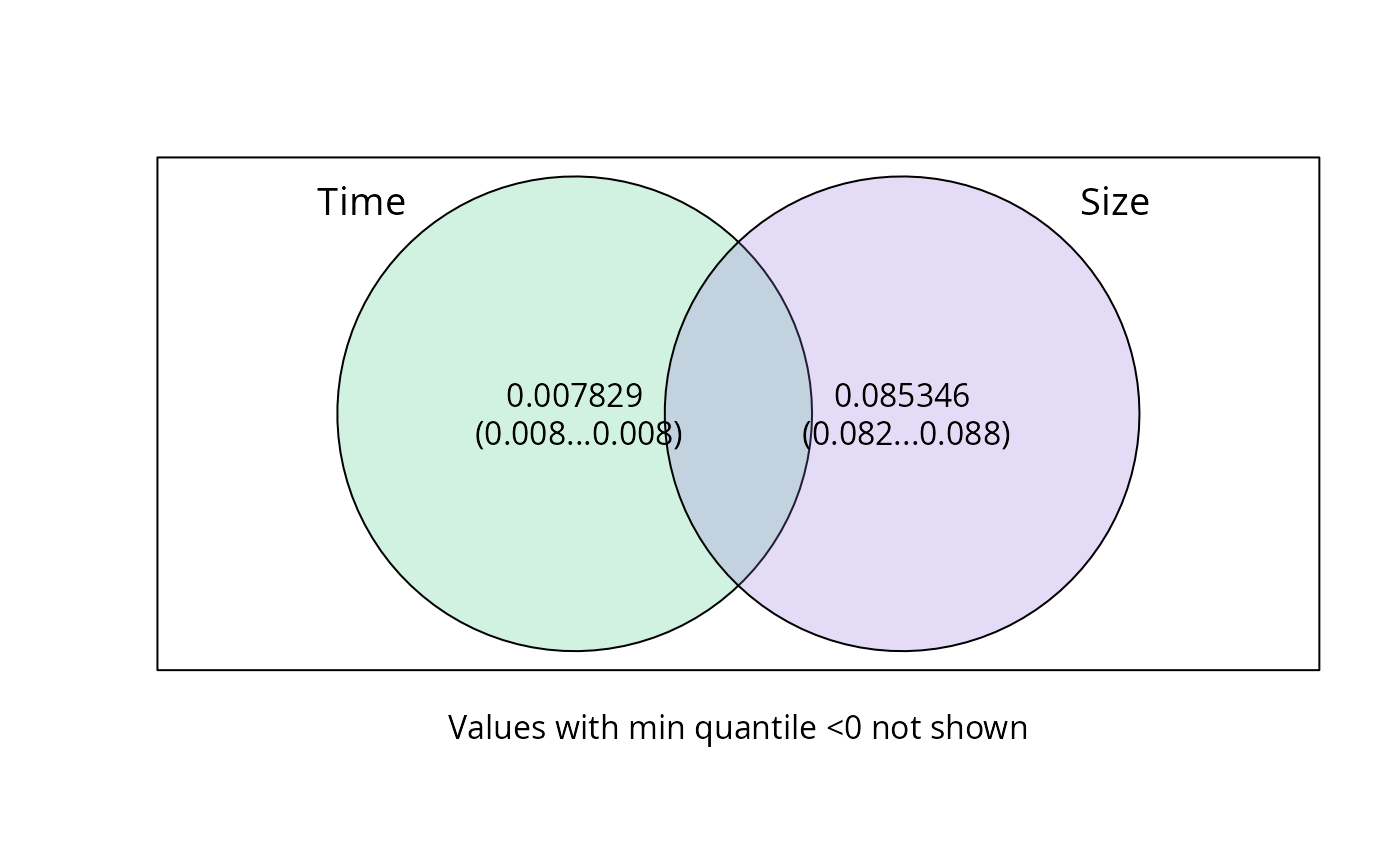
  plot_var_part_pq(
    res_var_2,
    digits = 5,
    digits_quantile = 2,
    cutoff = 0,
    show_quantiles = TRUE
  )
}
#>
  |
  |                                                  |   0%
  |
  |======                                            |  11%
  |
  |===========                                       |  22%
  |
  |=================                                 |  33%
  |
  |======================                            |  44%
  |
  |============================                      |  56%
  |
  |=================================                 |  67%
  |
  |=======================================           |  78%
  |
  |============================================      |  89%
  |
  |==================================================| 100%
  |
  |                                                  |   0%
  |
  |=========================                         |  50%
  |
  |==================================================| 100%


# }
# }
